New Pine Screener criteria added:
1) RelVol 10D %: vol since open vs avg full day volume
2) RS14/SPY: 14 day relative strength
3) Hod vs Prior: today's high vs yesterday's
See notes: https://t.co/J0JhlGYvMS
Free and open source. Beta script, not advice, not a trade signal.
Hey, here's the 'help' you've been seeking in trading—you already have it, but why do you not want to do it? That's what separates a successful trader from an unsuccessful one.
What if your trading journal could provide you with valuable insights by directly displaying consistent, and quantifiable statistics and patterns after you further dissect the data and perform a simple big data crunch? Consider the following perspectives, or approach it from the opposite angle;
i) You may have been significantly MORE profitable if you closed your trades based on a moving average aligned with your overall average holding period for winning trades, rather than the static moving average you currently 'believe' works best.
ii) You may already have a substantial edge with a WAY higher win rate and profit factor by focusing on stocks with market caps below $10 billion, rather than those above $10 billion, due to the nature of your entry and holding strategies. Your performance has been constantly eroded by either of it.
iii) You may have a substantial edge in trading slower moving mega cap due to the nature of your execution/exit and longer average holding period for winning trades than most swing traders. Don't fight the entry into fast moving stocks just because it works for SOME people. Some is not all. You may be a pro in your own niche which you didn't even know.
iii) You may have a CLEAR advantage in trading liquid ETFs over stocks, and your stock trades have been dragging down your profit factor and equity curve over time. This is no small matter—if you're trading a range of products, it's crucial to analyze their individual MoM profit factors, win rates, average holding periods, and more. They're not all equal, and you might discover an edge.
iv) You may come to realization that the majority of your winning trades with above average profit factor started from executing during high relative volume day.
v) You could eliminate more than 70% of your losing equity trades by incorporating high relative volume as a criterion in your trading system. This is a huge edge discovery. If you don't believe me, you reverse engineer all your trading statistics without this '70% of trades' and do a performance comparison.
vi) You could reduce 50% of your losing trades by avoiding executions before a pre-market economic data release scheduled for the following day. Do you not remember that few eventful market open that u suffered 3-4 series of gap down losses beyond your stop because you were trigger happy the day before? Discipline in this aspect could SHARPEN your trading performance.
vii) You could achieve a 30% higher average profit factor by scaling out 50% of your unrealized losses before they hit their eventual stop loss.
viii) You could minimize losing streaks by capping your daily consecutive executions to eg. 50% of your current maximum trade execution per day of the most recent quarter.
With perspective and angle your approach on improving your quarterly trading like the above, wouldn't you feel enlightened and eager to make adjustments and be able to approach your next trades with greater confidence and emotional control? The statistics in your journal aren't just about your strategy's edge—they reflect your behavioral approach to each trading day. You can't replicate another great trader's strategy and expect the same results, but with small tweaks and adjustments, you might even outperform them.
You already possess the tools needed to find the "holy grail" you've been seeking—it's just a matter of doing the work you've been hesitant to undertake.
My best - and by that I mean most confident - trading days are when I don't even look at the market until just before 10. Learning to let go of anxiety and trust the plan. Building custom screening and monitoring tools has helped a ton too. It either fits the plan or it doesn't.
Most traders dive into individual stock analysis. But Shake Pryzby points to research showing it's a smaller piece of the puzzle.
Market factors drive 40% of a stock's move, and sector trends 30%. The individual company? Just 30%.
Environment over individual names.
...and this is why we appreciate the @thesetupfactory community. No furus, no copy/follow trades, no closed opinions, just good insight and benevolent wisdom shared with other eager, open minded traders.
This is the time where who you listen to and follow is important. Listen to people like @jfsrev , @801010athlete and @Clement_Ang17 . Because they are objective in their analysis, that’s a key trait in trading.
Some of the biggest accounts on X, with the biggest following, have provided the worst advice with stocks down 50%+ in no time.
I see no point in fighting the trend, cash is also a position. What was a great trade can become your worst trade. Don’t argue with price.
If you don’t know when to get out, you are a boom and bust trader.
Anchoring to a prior regime or fundamentals are of the most dangerous things you can do. The narrative and fundamentals are fuel for an advance — but price is what leads it. Without price action confirmation, your narrative or earnings don’t matter.
Things change, and you must change with them.
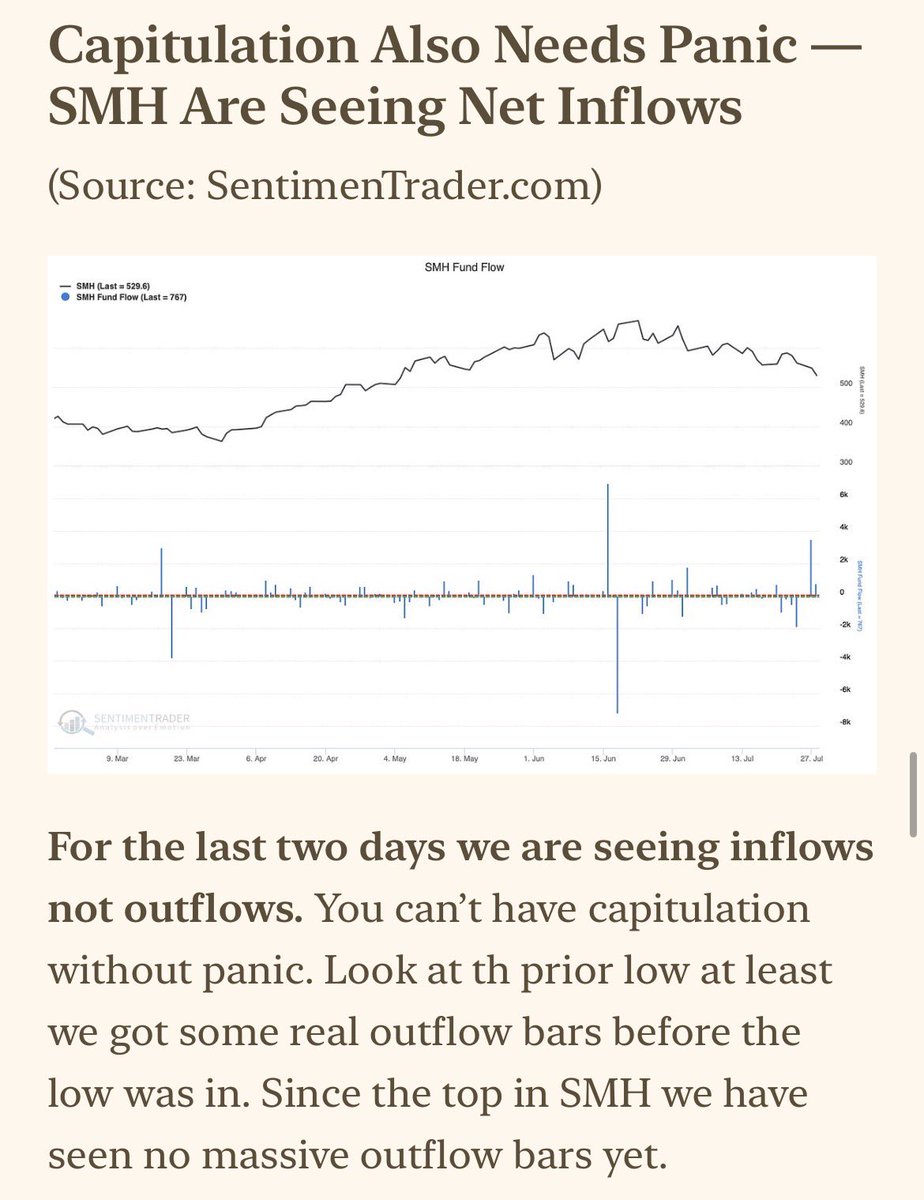
$SMH
$QQQ
$SPY
100%. Of course the view changes, as it should! Everything (!) needs to be taken in context of the market conditions. Strategy is always different for offense vs defense. "BUT YoU SaiD uP!" Everybody wants a day at the beach but ignore the whole incoming vs. outgoing tides thing.
Was one of the biggest $MU and $SNDK bulls while they were trending higher.
The trend changed, so did my view.
That’s trend following in a nutshell.
No need to be perma anything.
What actually is "breadth"? This article by @Muninn is a solid breakdown with a clear and simple conclusion. "The 10-day versus 20-day moving average on QQQ was the benchmark all of this was measured against, and the only rule that still worked..."
Market breadth: what actually works.
I tested 45 rules against 1,500 logged breakout trades. the Stockbee Market Monitor, new highs vs new lows, $MMTW, McClellan, % above the 20-day.
Which ones help, when they help, and when to ignore all of it. https://t.co/5Ee9sZLIWq
Favorite trading activity on days like these: review anything I felt even a little FOMO over lately and Let It Go. And it's a double win, reinforcing my no-fomo strategy while new opportunies form. Hands off pays off.
10 numbers every investor should know by heart:
6.9%
Real annualised return of stocks over 200 years. After inflation.
72
Divide by your return rate = years to double your money.
At 8%: 9 years. At 12%: 6 years.
40%
Of your total long-term stock return comes from reinvested dividends.
Spend them instead and you burn 40% of your compounding engine.
2%
Average annual inflation.
Over 30 years it cuts your cash’s purchasing power in half.
Over 50 years it destroys 73% of it.
10
The number of best trading days per year.
Miss them over 20 years and you lose half your returns.
Most fell during bear markets.
0.98
Correlation between S&P 500 and earnings growth over 30 years.
In the short term, sentiment rules.
In the long term, fundamentals always win.
4%
Safe withdrawal rate in retirement.
Historically lasts 30+ years without running out.
−14%
Average intra-year drawdown of the S&P 500.
Every year. Normal. Expected. Ignore it.
+36.4%
Average S&P 500 return in the 12 months after a midterm election year bottom.
The most reliable seasonal pattern in markets.
100%
Percentage of 20-year rolling periods that delivered positive real returns.
Every single one. In 150 years of data.
Save these.
They are worth more than most financial advice you will ever pay for.
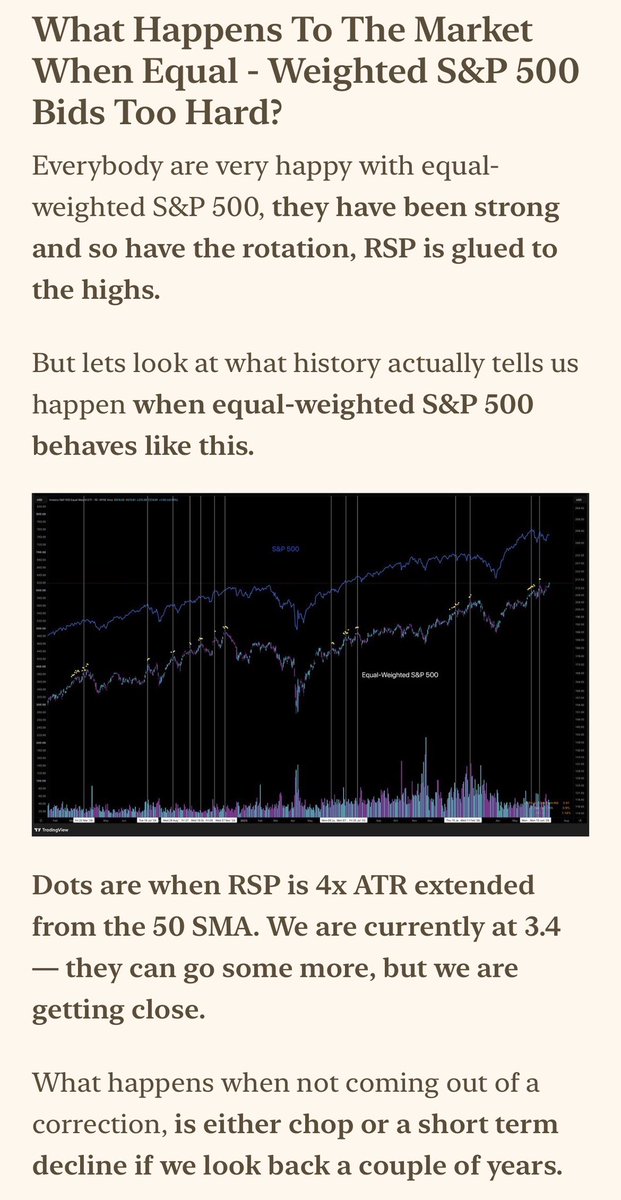
@ETFbreakouts@jfsrev This came from conversations w/ other traders about min/max preferences for that ATRx multiple (i.e. "no more than 4x from the 50sma") but the range is relative to each name, some are often much further extended than others so here we can see it relative to the history for each.
Since you asked—here’s another free, open-source TradingView script and one of my primary indicators:
Volume Surge & Dry-Up Highlighter
https://t.co/vDA1q6a1tg
I want to buy stocks under accumulation. Then, as price tightens before a breakout, I want volume to dry up—showing that supply has stopped coming to the market. On the breakout, I want volume to expand again.
I use this in conjunction with my VCP Tightness score and, most importantly, my own review of the chart.
High-volume up days above my RVOL threshold—1.5x here, but fully customizable—highlight the chart GREEN from top to bottom. High-volume down days highlight it RED.
I want to see plenty of green during the prior advance, followed by tight, quiet price and volume action. I do NOT want to see red in the days prior to the breakout (there are exceptions).
$BB is an extreme example, but a clean one. Look at all the green after the 4/9/26 earnings gap. Then look at the gray-filled inside day at the 10 EMA, with the gray dot directly below it. That marks the volume dry-up just before the stock continued into another huge move higher.
The exact RVOL multiple is shown beneath each qualifying high-volume bar, making it easy to review prior gaps and volume surges. I kept the labels small so they don’t clutter the chart—hover over one to expand it and see the full reading.
Remember this guys
You should feel FOMO when the market is ripping, you’re not making money, and everyone else is. That’s normal.
You should not feel FOMO when some of the best traders around you are telling you to stay patient and chill.
The market is absolutely doing nothing right now. Do not feel fomo for anyone bragging about 0de’s. It’s a common trap for amateur retail.
Just CHILL it will get better again.
@ETFbreakouts@jfsrev That's the key. You have to know what you want, and be able to refine AI results until you have it.
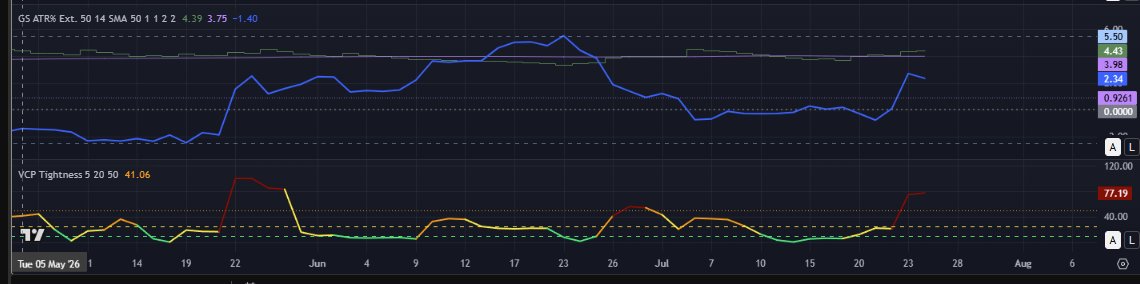
Top: My very simple ATR Extension Monitor https://t.co/ZhHp4SJz2C
Bottom: Your excellent VCP Tightness Score
https://t.co/ewRbh5aamq
Cool to see the correlation!