What matters are the simple things. The memories of family gatherings, the laughter shared with old friends, the sacrifices made for the people you love, XXX
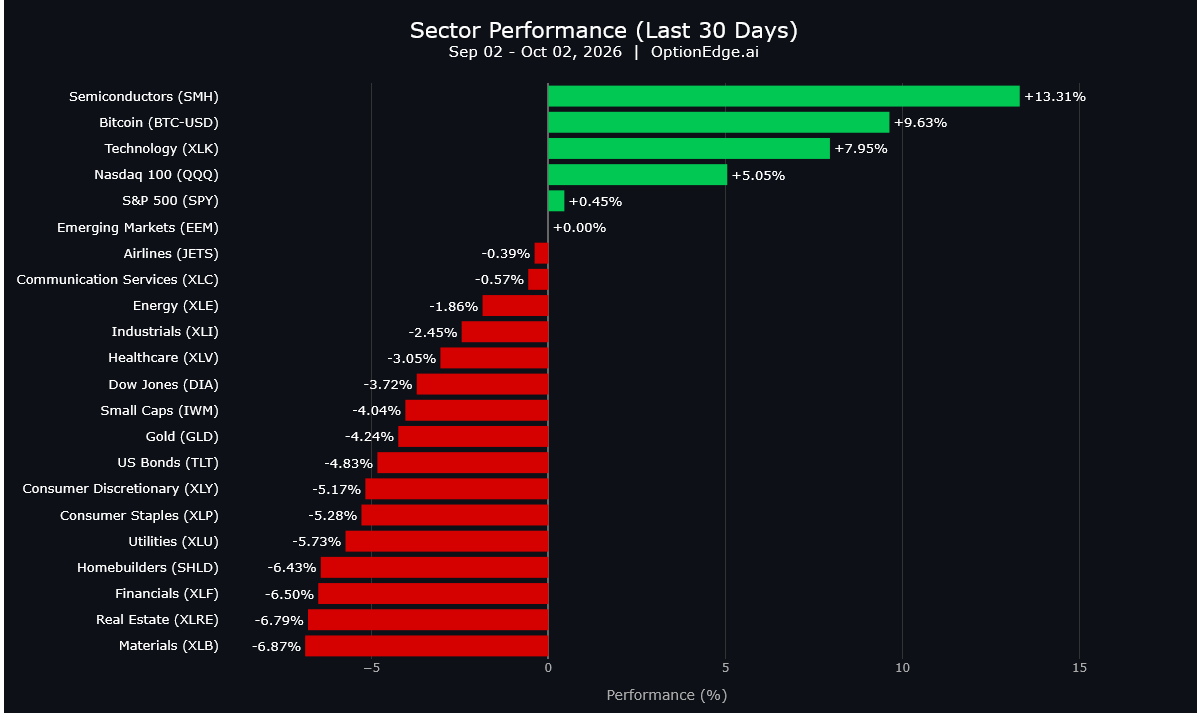
This is a bit weird: except for Bitcoin, semiconductors, and technology, almost every other sector is in the red on a 30-day basis.
This kind of extreme dispersion usually doesn't persist indefinitely. When leadership starts to weaken, the selling can spread quickly across the broader market.
So, the payroll euphoria we're seeing today may not last. The market could eventually shift its focus from the possibility of Fed easing to the underlying cracks in the economy and breadth.
We continue to be bearish on $SPY $IWM $TSLA
SEPTEMBER NONFARM PAYROLLS MISS BADLY:
- Jobs added were +29K vs +84K expected
- Unemployment rate increases to 4.2% vs 4.1% expected
The 10-year treasury yield just fell 0.77%, the $SPY is up 0.88%, and $BTC is almost at $87K on this news.
Why are yields falling and risk on assets going up if we are seeing unemployment go up and missing on the expected jobs number?
Well, that means the economy might not be as hot as the Fed thinks and we may not need to hike as aggressively as expected.
Bad news, in the eyes of the macro, might be good news again…
Here is a real-world example of how Canada's retaliatory tariffs actually work.
We are a Canadian manufacturer employing 40+ people in Ontario.
We buy steel drums from an American manufacturer in Ohio.
We bring the EMPTY drums into Canada.
We fill those drums in Ontario with products WE MANUFACTURE IN CANADA.
Then we ship the finished Canadian product back to customers in the United States.
Simple enough.
Except Canada has now imposed a 50% retaliatory tariff on U.S.-made steel drums under tariff code 7310.10.00.
So let me understand the strategy.
Who exactly are we trying to hurt?
The American steel company already sold the steel.
The American drum manufacturer already sold the drum.
Our American customer still needs the finished product.
The company writing the cheque for Canada's 50% tariff is us — the Canadian manufacturer employing Canadian workers.
And before someone says, "Buy Canadian" — we have a Canadian drum supplier in Burlington. They're busy and their lead times are several weeks longer than our Ohio supplier.
And here's the irony:
The Canadian drum plant is itself owned by an American company.
So we are potentially adding enormous cost and working-capital requirements to a Canadian manufacturer in an attempt to punish the United States.
There may be duty-drawback relief available because we're re-exporting these drums as part of our finished product — and we're investigating that now.
But think about the administrative absurdity we've created:
Import an American drum → Canada charges a 50% retaliatory tariff → Canadian workers fill it with Canadian-manufactured product → ship it back to America → Canadian company applies to recover the tariff.
That's not industrial policy.
That's friction.
If the objective is to protect and grow Canadian manufacturing, we need to start asking a very basic question before imposing retaliatory tariffs:
Who actually writes the cheque?
@ronmortgageguy@StephenPunwasi
The Market is either about to MOON or trap retail in the nastiest way EVER.
In this video I break down what I would need to see to confirm either scenario. At the end I tell you where I lean. $SPY $QQQ Oil $BTC all at critical points
Enjoy
The TWO rules I used to 10x my profits in the market through SWING trading.
I kid you not these made my performance do a total 180. I have tweeted about these concepts but today I bring you REAL chart examples and breakdowns of EXACTLY what I mean!
Enjoy
Tomorrow will be a fun livestream
@itsjcmerlo and @GAndersonTrades will be joining and we are gonna have some fun
This is not a livestream you want to miss. There’s a $500 giveaway up for grabs
I will see you all there. 3:30 PM ET tomorrow
2 rules that will SAVE you thousands SWING trading individual names. When I started trading, I ignored these concepts and lost TENS of thousands.
For trading leading assets:
- Wait for a range break that creates an FVG on the 4h, daily or weekly chart.
- Wait for a pullback into that FVG then press.
For trading laggards/catching knives:
- Wait until liquidity is swept
- Watch for a higher timeframe FVG at/near the sweep, tap it.
- Go long as soon as we close a daily candle above the previous days high.
(This can take a while to set up but it prevents you from catching a knife)
BONUS TIP: on recovery plays, it’s best when the stock/asset has cleared its 50MA.
There is your blueprint to either trading breakouts or catching knives the smart way using ICT
I gave long examples because I typically trade upside. You can just flip these examples around for shorts and it will work when applicable. Nfa
This is what you NEED to understand about the market here as a BULL OR BEAR
$SPY & $QQQ **SHOULD** tag all time highs soon. Here is what you NEED to know
If $SPY makes another all time high and $QQQ once again fails to, which kicks off a rejection/selloff (like in August) that is a VERY iffy sign for the markets
If both make new all time highs but stall out notably and show weakness, EXPECT a deeper selloff in the fall
If we BLAST through all time highs and don’t look back, we are in a replay of April-May and will likely run another 10-15% by year end.
It is hard to tell which is most likely. I see them all about even right now.
I will update if and when we test/make new all time highs. That will be telling…
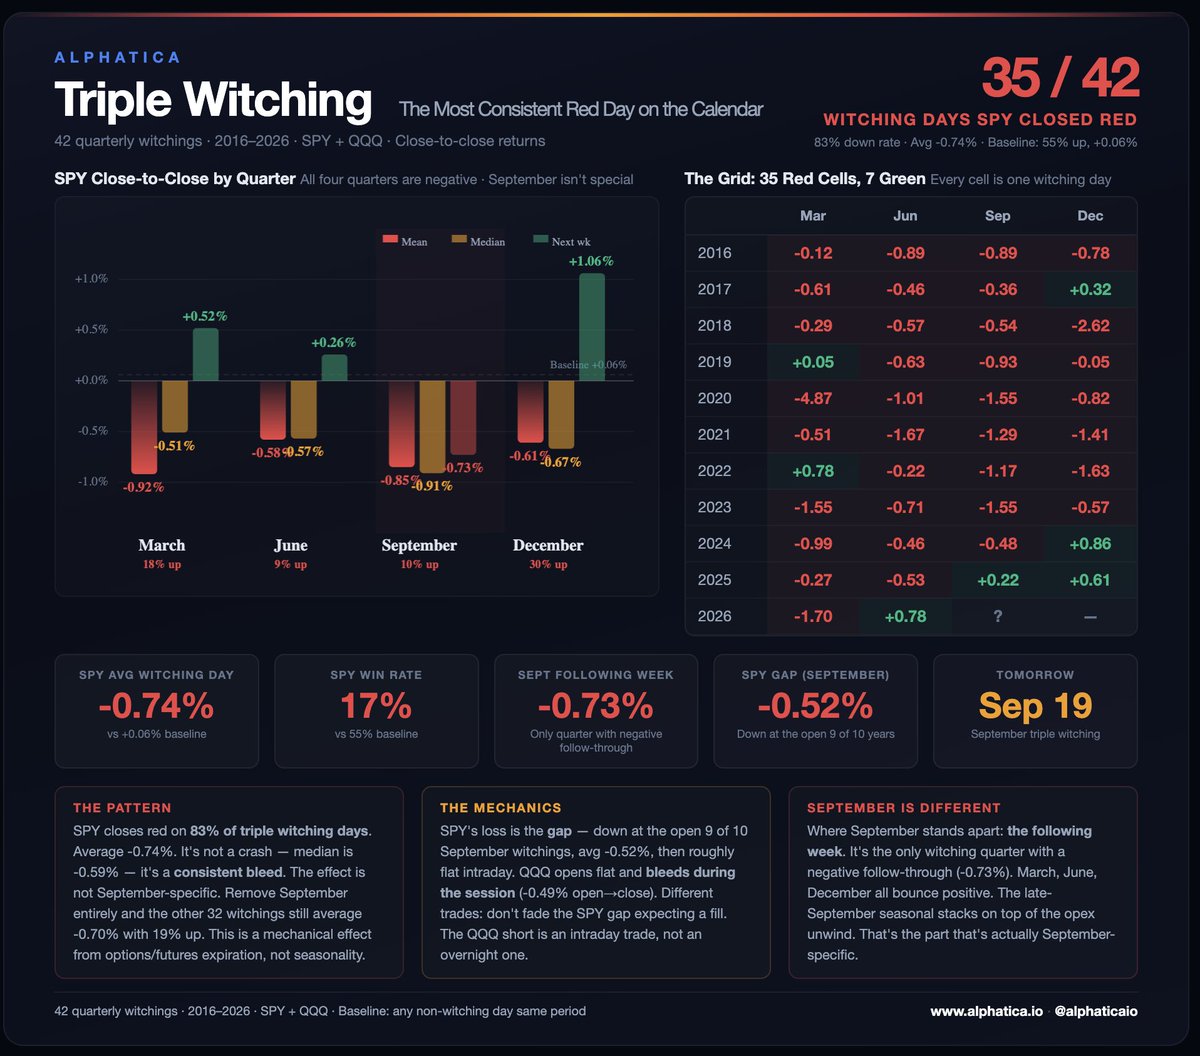
🚨🚨Tomorrow is September triple witching. We studied the last 42 quarterly witchings. This is one of the most lopsided calendar effects in the market.
SPY has closed red on 35 of the last 42 triple witching days. 83% down rate. Average: -0.74%. Baseline for any random day: 55% up, +0.06%.
This is not a September story. All four quarters bleed:
March: 18% up, -0.92% avg
June: 9% up, -0.58% avg
September: 10% up, -0.85% avg
December: 30% up, -0.61% avg
Remove September entirely and the other 32 witchings still average -0.70% with 19% up. The effect is fully intact without it. This is mechanical meaning options and futures expiration driving dealer flow, not seasonal.
Where September IS different: the following week. It's the only witching quarter with a negative follow-through (-0.73%). March, June, and December all bounce positive the next week. The late-September seasonal stacks on top of the opex unwind.
The mechanics are different by ticker. SPY's loss is the gap, down at the open 9 of 10 September witchings, avg -0.52%, then roughly flat intraday. QQQ opens flat and bleeds during the session (-0.49% open→close). Don't fade the SPY gap expecting a fill. If QQQ is the trade, it's an intraday trade, not an overnight one.
The caveat: 4 of the last 7 witchings have been green. Dealers may be adapting to a well-known pattern. But 35 out of 42 is the base rate, and the base rate says tomorrow is red.
Tomorrow's stack: triple witching + FOMC hike Wednesday + oil above $100 + September seasonal. Four headwinds in one week.
$SPY $QQQ $IWM
$VIX Last 4 months worth of Friday's (or the day before if holiday):
Sept 11th: -11.20%
Sept 4th: +1.47%
Aug 28th: -0.55%
Aug 21st: -5.50%
Aug 14th: -2.60%
Aug 7th: -1.65%
Jul 31st: -6.44%
Jul 24th: -0.64%
Jul 17th: +12.19%
Jul 10th: -5.11%
Jul 2nd: -2.65%
Jun 26th: -2.54%
Jun 18th: -11.06%
Jun 12th: -9.05%
Jun 5th: +39.68%
May 29th: -2.67%
May 22nd: -0.36%
14 reds, 3 greens.
Quite the streak. But keep in mind tomorrow is triple witching.
THE VOTE TO HIKE RATES WAS UNANIMOUS
MOST FED VOTING MEMBERS EXPECT 1 MORE RATE HIKE THIS YEAR
4 MEMBERS EXPECT 2 MORE RATE HIKES THIS YEAR
KALSHI ALSO EXPECTS 1 MORE RATE HIKE THIS YEAR
@TheProfInvestor Can I add, the Djia also has a 3 gap down pattern that is a fairly reliable pattern, I'd like to think all indices bounce tomorrow as well it being 9/11, GL and big thx for all the info and charts you provide!
Perhaps you were wondering how SPX did from Labor Day through year end in 2018, the other Trump midterm year.
Can you imagine going sideways for a whole other month first?
Because I'll kill myself.