Peter Lynch famously said there's a "100% correlation" between earnings and stock price over time.
If that's true...
These 10 stocks may be screaming opportunity.
1. $NFLX - Netflix
We are about to experience a massive end-of-Q2 rebalancing period:
Institutional investors are estimated to sell up to $165 billion in equities and purchase an equivalent amount of bonds by quarter-end, the highest in at least 4 years, according to JPMorgan.
Japan's Government Pension Investment Fund (GPIF), with ~$1.9 trillion in assets, is estimated to sell ~$60 billion in equities, while Norway's Norges Bank, managing a ~$2.1 trillion sovereign wealth fund, is expected to sell ~$40 billion.
At the same time, US defined benefit pension funds, managing ~$9.6 trillion in assets, could account for another ~$55 billion in equity sales.
The Swiss National Bank is estimated to sell ~$25 billion, though this figure could fall to ~$8 billion if its equity allocation rises to 30% from the current 28%.
Meanwhile, balanced mutual funds, managing ~$4.0 trillion in assets, are estimated to purchase ~$15 billion in equities.
A massive quarter-end rebalancing wave is about to hit global markets.
💧📈 Liquid Leader Stock Scan: Price Structure 📉
149 of 2,489 stocks grouped into columns based on the price structure of key moving averages at close.
$SPCX 🚀 went to the moon 🌝 as the most extended stock ... time to re-enter 🌎 atmosphere?
Font colors:
🟠Trend inflection point upward
⚪️Trending upward
🟢Buyable
🔵Reduce 50% if holding
🍐Restore full position if trimmed (Lime)
🟣Extended (7x ATR-to-SMA50 or greater)*
🔴Sell 100% if holding
🟤Trend inflection point downward
🐘Trending downward (gray)
If you are a swing trade this is what you WANT to print out and put on your desk.
Thanks Denis for the study and @jfsrev for the referral on your substack!
That doesn't happen every day 🤔
The same politician who bought SanDisk at $42 just invested ~$45K in a stock with a market cap of ~$981M
Politician: Ro Khanna
Stock: $VYX (NCR Voyix)
Watching this closely
It should not matter which screener you look at - the key is to focus on the green/lime font names if you are looking for long ideas.
For example:
Pic 1 shows the 145 (5.9% of 2,467 +$1B) strong, bullish stocks, which is a wide net that stocks that are performing well.
In my opinion, this is a decent set of stocks for someone to look for setups that meet their own personal setup/criteria and has already
Pic 2 is the 65 (of the 145) subset of these stocks which are green/lime font - this would be my personal watch/focus list.
Pic 3 is 13 of the 65/145 stocks that are on the green/lime watchlist that are also in "leading industry groups".
Energy has been building in $DAVE for a year as sales and earnings continue to show steady growth.
The action of the last 2 months shows a cup & handle developing. No position for me yet, a worst case stop would go below the green arrow (last weeks low)
Chart from @Marketsurge free access all this week https://t.co/u8SPB8Fwye
Make the trade your own
With a rising 20, 50, 200 SMA on the daily and a flat/rising 5sma on the 30 minute inset chart $NBIX is looking like it is getting ready for a continuation higher from the recent earnings gap
A worst case stop would go under the low from last week (red arrow)
Daily chart with 30 minute inset from @marketsurge
FOCUS Tomorrow
$AMD - Nice Little base Breakout
$HPE. - Excellent Earning Low of the Gap Up on watch
$RR - Tight Flag
$GCTS - Tight Flag
$AIP - Nice Mini Base Breakout on watch
$LSCC - Strong Semi nam, Mini Base Breakout
$STUB - Relatively new IPO, super tight price action
$RGTI - Flag Breakout on watch
FOCUS Tomorrow
$NVDL $NVDA - Massive Catalyst
$STUB - Beautiful Mini Base and Flag
$BLDP - Flag and Tight price action, very strong RS
$RVI - Right at rising 21, tight price action
$TBLA Not seen better Bull Flag Than This recently
$SWMR - Drone Theme $ONDS $UMAC $INFQ similar look
$NAVN - IPO Base Breakout
$MX - New Semi strong name Gap up Low of the Day set up
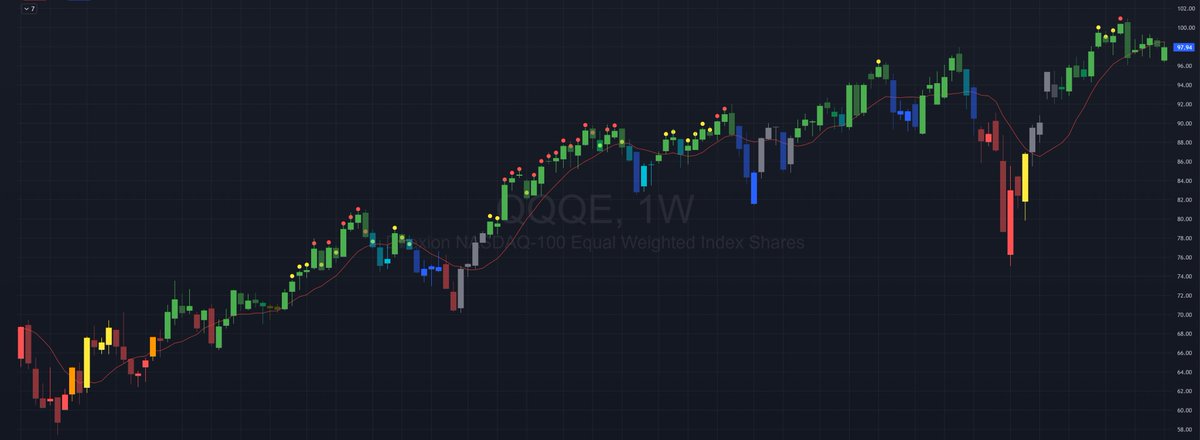
💧📈 Liquid Leader Stock Scan: Price Structure 📉
1st June 2026
147 stocks* grouped into columns based on the price structure of key moving averages at close
Font colors:
🟣Extended (7x ATR-to-SMA50 or greater)*
🟢 Buyable
🟠 Trend inflection point upward
🟡 Restore full position if trimmed
🔵 Reduce 50% if holding
🔴 Sell 100% if holding
* the box on the column 'Ext' shows (and is sorted largest-to-smallest by) the ATR-to-SMA50 extension
Don’t buy overextended stocks ⚠️
If you go back in history and examine stocks that are 7× ATR or greater relative to the SMA50 (i.e., red font), you will find they usually either:
- go sideways/consolidate, permitting the key moving averages (MA10/20/50) to catch up before making the next leg higher, or
- pull back to the moving averages.
This is fractal in nature.
Below are some commonly traded instruments—notice the yellow dots (7× to 11× extended) and red dots (11× or greater extended), then the subsequent price action.
If you are buying stocks this extended from the SMA50, there is a high probability of the stock going sideways and/or pulling back.
See this post for further details:
https://t.co/ECCxqtx5Az
Best of luck! 🍀
To my knowledge, only if your screen already filters to 40 stocks or less.
TradingView "pinescreener" is currently that is limited to a maximum of 1000 stocks in a watchlist and it will only process 40 stocks before stopping.
When reviewing a individual chart in TV, you can use @jfsrev and @DumbleDax excellent public indicators to determine the ATR-to-SMA50 extension.
https://t.co/pKNZAvsqQu
https://t.co/GsnBxfra1a
Hope it helps - best of luck! 🍀
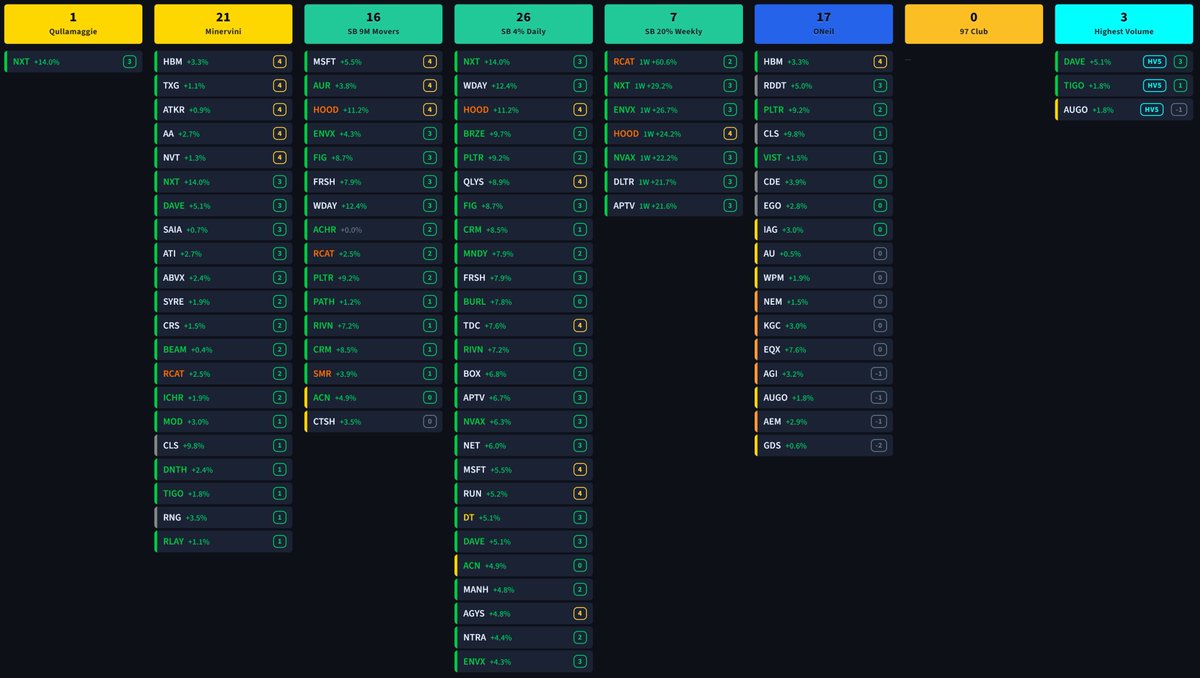
📈Guru Screener - Qullamaggie Minervini Stockbee O'Neil
Below is the "Guru" scanner* of the excellent work of Qullamaggie, Minervini, Stockbee and William O'Neil
- Qullamaggie Breakouts
- Minervini Trend Template
- Stockbee 9 Million Movers
- Stockbee 20% Weekly Movers
- Stockbee 4% Daily Movers
- O'Neil CANSLIM
- Highest Volume in 5 Years
* based on my interpretation
Results have been limited to stocks less than 5x ATR-to-SMA50. The ATR-to-SMA50 extension is shown in the badge.