@cryppimagic Very interesting guide! How long do you keep your trades open, more of a swing trade and you wait that it TP/SL eventually? Funding rate isnt always very positive/negative for a long period of time thats why i was wondering. I need to explore your platform more.
@m_rivera_trades@PJtrades_NQ I think depending how many prop accounts you have it’s better to trade it by pairs. Let’s say pairs of 2/4 and rotate so you minimize your risks of blowing up on a bad streak.
BREAKING: The median listing price of existing US homes fell -2.4% YoY in May, to $429,500, the largest annual decline since at least 2017.
On a per-square-foot basis, prices declined -2.5% YoY.
This comes as listing prices fell in 35 of the 50 largest US metros, with Memphis leading at -13.0%.
Buffalo followed at -11.6%, Austin at -9.5%, Los Angeles at -7.9%, and San Diego at -5.6%.
In total, this represents a swing of more than 20 percentage points from the peak annual growth rate of +18.0% seen in June 2022.
This comes as mortgage rates remain elevated, buyer demand continues to weaken, and CPI inflation has risen for the 4th consecutive month, further squeezing affordability.
The US housing market correction is gaining momentum.
Elon Musk hasn't sold a Tesla share in years and lives off $1 billion in personal loans
His Tesla stock keeps appreciating
The loans charge him 2-3% interest
The IRS never sees a single dollar of capital gains tax
This is exactly how the wealthiest people in America accumulate wealth without paying taxes and it's available to anyone with $100K+ in assets
The strategy is called "borrow against appreciated assets" or sometimes "buy borrow die." It's the single most powerful tax-minimization strategy used by ultra-wealthy individuals in America
Mechanics:
When you SELL an asset that has appreciated, you owe capital gains tax. Federal long-term capital gains rates: 0%, 15%, or 20% depending on income. Plus state capital gains in most states (CA: 13.3%; NY: 8.82%). Plus net investment income tax of 3.8% for higher earners (IRC Section 1411)
For someone like Elon Musk selling $1B in Tesla stock, the total tax bill would be approximately:
Federal capital gains at 20%: $200M
Net investment income tax at 3.8%: $38M
Texas state tax: $0 (Texas has no state income tax, this is why Elon moved there)
Total tax bill on selling $1B: $238M
When you BORROW against appreciated assets, you owe ZERO tax. Loan proceeds are not income under IRC Section 61. They never appear on your tax return. They never trigger a tax event
For Elon to access $1B in cash for spending purposes, the math is:
Sell $1B in Tesla stock: $762M in net proceeds after tax
OR
Borrow $1B against $1B in Tesla collateral at 2-3% interest: $1B in net proceeds tax-free
Selling costs him $238M in taxes
Borrowing costs him $20-30M/year in interest (or roughly $200-300M over a decade if held that long)
But the borrowing strategy has additional benefits:
Tesla stock continues to appreciate. Over 10 years, $1B in Tesla stock has historically appreciated to multiples of that. Selling locks in the gain at today's value. Borrowing keeps the upside
The interest paid on the loan is potentially tax-deductible if structured as an investment loan (IRC Section 163(d)). Effective after-tax cost can be reduced to 1-2%
The loan never has to be repaid during his lifetime. He can refinance it indefinitely. When he dies, his heirs inherit the stock at a "stepped-up basis" (IRC Section 1014). The accumulated capital gains die with him. The heirs sell the stock at the stepped-up basis, pay off the loan, and keep the entire upside tax-free
The wealth transfers from Elon to his heirs entirely tax-free if structured correctly. Estate tax is a separate question but is largely avoidable through proper trust structures
The ultra-wealthy version of this strategy:
Borrow against appreciated stock
Use the loan proceeds for consumption (homes, cars, art, business operations)
Never sell the underlying stock
Refinance the loan at maturity to extract more cash if the underlying has appreciated
Pass everything to heirs at death with stepped-up basis
Heirs sell with $0 in accumulated capital gains tax owed
This strategy is sometimes called "buy, borrow, die" by tax planners. It's the foundation of how billionaire wealth perpetuates across generations without significant taxation
Available products for this strategy:
Pledged Asset Line (Schwab): borrow up to 50-70% of portfolio value at SOFR + 1-2%
Securities Backed Line of Credit (Morgan Stanley, Goldman): similar terms, $1M+ minimum
Custom Lending Solutions (private banking): for $10M+ portfolios, rates can drop to 1-2%
The accessibility tier:
If you have $100K+ in investment assets at Schwab/Fidelity/Vanguard, you can open a Pledged Asset Line. Typical terms: borrow up to 50% of your portfolio value at SOFR + 1.5-3% (current rates roughly 6-8% all-in). No fixed monthly principal payments. Interest only or pay nothing as long as the loan stays below the maintenance threshold
For someone with $200K in stocks/ETFs:
Borrow $100K at 6.5%
Use the $100K for any purpose (real estate down payment, business operations, etc.)
Annual interest cost: $6,500
Tax savings vs selling stocks: roughly $20,000-$30,000 in deferred capital gains
Net benefit: $13,500-$23,500/year in tax savings during the borrowing period
For someone with $1M in stocks/ETFs:
Borrow $500K at 6.5%
Use the $500K for real estate purchases, business equity, etc
Annual interest cost: $32,500
Tax savings vs selling stocks: roughly $100,000-$150,000 in deferred capital gains
Net benefit: $67,500-$117,500/year
Comparison to the alternative:
If you sell $500K in long-term appreciated stock to access cash:
Federal capital gains at 15%: $75,000 owed
State capital gains (varies): $20,000-$40,000 owed
Net cash to you: $385,000-$405,000
If you borrow $500K against the same stock:
Net cash to you: $500,000
Tax owed: $0
Annual interest cost: $32,500
Even paying $32,500/year in interest, you're $90K-$110K ahead in year 1 and the gap grows because your stock keeps appreciating while you hold it
The compounding effect over 20 years:
Person A sells $100K of Tesla stock at 15% capital gains, takes $85K. Spends it
Person B borrows $100K against $100K of Tesla stock, takes $100K, spends it. Stock keeps growing at historical rate (let's say 20%/yr conservatively)
20 years later:
Person A: stock is gone. Whatever they bought with $85K is whatever it is
Person B: still owns the original $100K in Tesla, now worth $3.8M. Refinanced the loan multiple times. Currently owes maybe $200K against $3.8M in collateral. Net wealth on this position: $3.6M
Same starting position. Different decision. $3.5M+ difference in 20 years
Important caveats:
The strategy works only when underlying asset is appreciating
Margin call risk if asset value drops below maintenance threshold
Interest costs accumulate over time and eventually reduce the net benefit if rates rise enough
Some borrowing limits apply (typically max 50-70% of portfolio value)
The strategy is most powerful for:
Concentrated stock holdings in publicly traded companies (especially employee stock from tech companies, founder stock, ESOP grants)
Large diversified portfolios held in taxable brokerage accounts
Real estate equity (similar strategy via cash-out refinances)
Business equity (some forms of borrowing available against ownership stakes)
The strategy is least useful for:
Small portfolios under $50K (interest costs eat any benefit)
Retirement accounts (can't borrow against IRAs/401(k)s; some 401(k)s allow loans but limited to $50K)
Assets without an established lending market (collectibles, private real estate that's hard to finance)
The reason this isn't standard financial advice:
Most financial advisors are compensated based on assets under management. They make more money when you keep assets invested. They don't necessarily make money when you optimize for cash extraction. The strategy is genuinely good for sophisticated clients but doesn't fit the standard advisor compensation model
Banks DO know about this strategy. They actively market it to wealthy clients. The Pledged Asset Line and securities-backed line of credit products are billion-dollar businesses at every major brokerage. They're just not marketed to ordinary retail clients because the minimums and complexity make them inappropriate for mass market
The threshold for accessing this strategy:
$100K+ in liquid investment assets = entry-level access via Schwab/Fidelity
$1M+ = full access to most products and competitive rates
$10M+ = access to private banking rates of 1-2%
$100M+ = Elon-level rates of essentially 0% real cost after tax deduction and stock appreciation
At each tier, the math becomes more favorable. The richest Americans access this strategy at rates that mean borrowing $1B is essentially free relative to their portfolio appreciation
Most middle-class Americans never use this strategy because:
They don't know it exists
They don't have $100K+ in taxable investment accounts
They follow standard advice that says "live within your means and don't borrow"
The wealthiest Americans use it constantly because:
They have the assets
They understand the math
They follow advice from advisors who are sophisticated about tax optimization
The gap between the two groups isn't talent. It's understanding that the tax code is written to reward holding assets indefinitely and penalize selling them. Selling = taxable event. Holding + borrowing = no taxable event. The system rewards never realizing gains
Elon never sells Tesla. He never pays capital gains tax. The IRS doesn't collect a dollar from his accumulated wealth. The strategy is legal. It's mathematically optimal. And it's been written into the tax code since before any of us were born
You don't need to be Elon to use this strategy. You need $100K and a Schwab account
(we get business owners up to 250k in 0% interest business funding, link in bio)
@TritonTrades@edgeful Is the data only based of your custom settings of the session times? As you set London session as 2AM to 5AM EST. Even though it really ends at noon. What would be the difference if you set london until 9.30am EST?
The market tells you the entire day's direction before 9:30 AM even opens
Not with indicators. Not with news. Not with "gut feeling"
With a single candle that printed 3 hours before you woke up
95% of retail traders show up at 9:30 blind. The 5% who check this one thing already know which way the market is going before the opening bell rings
Here's what nobody teaches you:
Every trading day has a script. And the script gets written between 2:00-6:00 AM while you're sleeping
It works like this:
The market moves in sessions. Asia. London. New York. Each session has a job. And if you understand the job of each session, you already know what the next one is going to do before it opens
The sequence:
If the previous session REVERSED - the next session CONTINUES
If Asia reversed? London continues. If London reversed? New York continues. If no session reversed? New York is the reversal
That's it. That's the entire daily script. The market rotates between reversal and continuation across sessions. It has done this every single day for decades
Here's how the script actually plays out:
SCENARIO 1: London reversal -> New York continuation
London opens at 2:00 AM. It pushes price into a key level - previous day's high or low, a fair value gap, a relevant swing. It sweeps the liquidity. It reverses. By 6:00 AM, London has already decided the direction
The 6:00 AM candle confirms it. If it swept a high and closed back below it - bearish day. If it swept a low and closed back above it — bullish day
Now New York opens at 9:30. The direction is already decided. NY's job is not to figure out where the market is going. NY's job is to CONTINUE what London started
This is why the 9:30-11:00 window is so powerful. You're not guessing. You're continuing a move that's already confirmed
Price opens. It pulls back into a fair value gap that London's expansion created. That gap is your entry. Stop behind the gap. Target the next liquidity pool. Done by 10:30
SCENARIO 2: No previous session reversed → New York reversal
Asia consolidated. London consolidated. No session made a move. No expansion. No gaps. No direction
This means New York has to do it. 9:30 is the reversal session
This is where the volume comes in. 8:30 news or 9:30 open - institutions use this to push price into a key level, grab liquidity, and reverse
You wait for the sweep. You wait for the displacement. You wait for the V-shape signature - aggressive move in, aggressive move out, gap forms. That's your reversal confirmation
SCENARIO 3: Asia reversal → London and New York continue
This is the highest probability day. Asia already put in the low or high of the day. Every session after just expands in the same direction
When Asia is the low of day, the 4-hour candles that form after will be expansion candles. Those expansion candles create gaps. Those gaps are your entries for London and New York continuation
You mark the gap within the previous 4-hour candle's range. You wait for price to pull back into it. You enter. Same direction all day. Multiple opportunities. Same setup repeating
The model behind all of this:
Price only does two things. It moves from internal liquidity to external liquidity. Then back. Forever
Internal = fair value gaps. Where orders didn't fill. Where price returns
External = swing highs and lows. Where stops sit. Where price sweeps
Price sweeps external -> fills internal -> targets opposite external
Every session. Every day. Every asset. Every time frame
The session just tells you WHEN the next leg of that cycle starts
How I use this every morning:
6:00 AM - Check the 4-hour chart. Did the previous session reverse or just consolidate? If London reversed, I'm trading New York continuation. If nobody reversed, I'm trading New York reversal
6:05 AM - Mark the 6 AM candle. Did it sweep a key level and close back inside the range? Reversal day. Did it expand through? Continuation day
9:15 AM - Mark the gap from London's expansion. That's my entry zone. Mark the next external liquidity. That's my target
9:30 AM - Watch for price to pull back into the gap. If I'm trading continuation, I want a shallow retracement. If I'm trading reversal, I want the V-shape
9:45 AM - Entry confirmed. Stop behind the gap. Target the next draw on liquidity
10:30 AM - Either in profit or stopped out. Done
11:00 AM - Laptop closed. Day is over
A trader I work with used to show up at 9:30 and "react to price action" for 6 hours. 43% win rate. Breaking even after fees
I told him one thing: check what the previous session did before you sit down
He started profiling sessions. London reversed? He only looked for continuation. Nobody reversed? He waited for the 9:30 sweep and reversal setup. No setup in the first 90 minutes? He closed the laptop
Same strategy. Same setups. Same risk. Added one filter
Win rate went from 43% to 64%. First funded account within 60 days. Now he's done trading by 10:30 every morning
He didn't learn a new strategy. He learned to read the script that the market writes every morning before he wakes up
The sessions tell you the direction. This model tells you the entry. The gap tells you where. The sweep tells you when
Most traders spend 6 hours searching for setups that the market already showed them at 6 AM
The script is free. It prints every single morning. You just have to learn to read it
Or keep showing up at 9:30 blind and wondering why you're not profitable
Your choice
(I teach session profiling and the model i use inside my free Discord. Live every morning before the open. Link in bio. DM me "SYSTEM" for 1-on-1 coaching)
#Bitcoin – What’s Next?
The Big Sunday Report: All We Need to Know
🚩 TA / LCA / Psychological Breakdown: A few days ago, I gave a long at the 71k region and mentioned targets of the 79–84k region, and I am now changing something in the plan! I previously said that between 79–84k I would take profit of the long and ADD more SHORTS, this strategy has now changed and is very important to understand!
My long from the 71k region remains open, but my take profit has changed. Instead of taking profits between 79–84k, I will take HALF OF THE POSITION SIZE as profit at the 76,200 region, and this is also very important to understand! I am NOT adding short orders at 76,200, but still between 79–84k in case the market allows a move there. The other half of the long will also be closed between 79–84k if the market reaches that region. Once 76,200 is hit, I will take profit on half of the position size of the long and move the stop loss to entry to avoid any loss and secure 50% of the profit. I hope this makes sense now. You might wonder where this shift comes from, and I need to admit a small mistake in my calculation: the probability of hitting 76k is very high, but the probability of reaching 79–84k is currently medium. Because of this, I am adjusting my take profit areas. Overall, the short from 115–125k remains open, and additional short orders are placed between 79–84k in case the market reaches that zone, I am not interested to add short orders at 76k region, just if we move higher and we see higher FOMO, I would be interested to add between 79-84k, not earlier.
I am expecting a large downside move in the coming weeks, it should not take much longer, as the move is very close. I am expecting the S&P 500 to crash within the next two months, with a downside move of more than 35%. In comparison, the S&P 500 dropped 34% during the COVID black swan event. I am expecting a much larger downside move this time, with a heavy domino effect.
I am expecting a large trap for bulls as well, something market makers will use to send us lower into the 50s area and even further afterward. We have not bottomed out. The only question now is: how high will we rise before continuing downward? Will it be 76k before rejection, or will we reach the 79–84k region first? This question needs more time to be answered with clarity. While I see the probability of 76k as extremely high, I currently see 79–84k as medium probability, and therefore I am adjusting my trade accordingly. Profit is the only option and I am using every move to make a profit, no matter what my bias are!
As always, I am very transparent with you regarding my trades and decisions, and I want to personally thank you all for the support you are giving. Congratulations to everyone who took the short with me at the exact top, I will keep it open and realize it at much lower levels than where we are now.
Join DrProfit Premium now: https://t.co/Ice9n2uknI
Agreed! STOP over trading! I have been more consistent sticking to ONE session rather than trying to catch every moves and get burned! NY open, 6.30 to 9am PST (for me) is the best market, why lose your money in the Asian chops to make a few dollars.
I analyzed every blown prop account from my students and found that 86% of them broke their daily loss limit during the same 90-minute window
Not random times. Same exact window.
Here's the 3-hour trading window rule that saves accounts:
The data is fucking brutal:
Accounts that traded ONLY 8am-11am: 8% failure rate
Accounts that traded ONLY 3am-5am: 71% failure rate
Accounts that traded 3am-5am AND 8am-11am: 86% failure rate
Wait what?
Trading BOTH sessions increased failure rate from 8% to 86%
How?
FATIGUE
Here's what actually happens:
SCENARIO A (Single 3-hour window):
Trader wakes at 7:45am
Trades 8am-11am only
Takes 2-3 setups
Makes $600-800
Done by 11:15am
Closes laptop
Rested brain
Win rate: 68%
SCENARIO B (Double session):
Trader wakes at 2:45am
Trades 3am-5am
Takes 2 setups, up $500
Stays awake for NY open
Trades 8am-10am (FATIGUE)
Takes 4 more setups (FORCING)
Gives back $500 and loses $800 more
Down $800 total
Revenge trades
Daily limit hit
Account blown
Same trader
Different approach
Funded vs blown
The psychology breakdown:
8am-11am ONLY:
- Fresh brain
- 2-3 quality setups
- Profitable
- Done
- Discipline intact
3am-5am THEN 8am-11am:
- 3am-5am: staying awake (fatigue building)
- 8am: brain is fried
- Takes marginal setups (tired judgment)
- Overrides stop loss (exhausted discipline)
- Revenge trades losses from fatigue
- Blows account
The rule that saves accounts:
PICK ONE 2-3 HOUR WINDOW
Trade ONLY that window
Close laptop after
No exceptions
The implementation:
STEP 1: Choose your window
- 3am-5am London open
- 8am-11am New York
ONE window only
STEP 2: Set hard stops
- Laptop closes after 3 hours
- Platform logs out automatically
- Phone in airplane mode
STEP 3: Track compliance
- Did I trade only my window? Y/N
- Did I close platform after? Y/N
The results after implementing this:
Before 2-hour rule (trying to trade all sessions):
- Average trades per day: 8.4
- Win rate: 49%
- Accounts blown: 7 in 90 days
- Average lifespan: 12 days per account
After 2-hour rule (one window only):
- Average trades per day: 2.3
- Win rate: 67%
- Accounts blown: 0 in 90 days
- Current streak: 180+ days funded
Same strategy
Same person
Different window discipline
0 blown accounts vs 7 blown accounts
The traders making $40k+/month:
They trade 2 hours per day
Not 8 hours
The traders blowing accounts:
"I need to catch every opportunity"
No mf
You need to catch the 2 hours where your brain actually works
Your edge exists in your window
Not in every session
More time ≠ more money
Right time = more money
Pick ONE window
Master it
Get funded
Stay funded
That's the game
i teach my whole system in my free discord. link in bio.
(and if you want to work through this 1 on 1 and you're not broke -> DM me "SYSTEM." i'll show you exactly how to build it, set it, and collect from it every month.)
🚨 If you’ve blown up your account trading the NY open EVERY day this past week…
You’re not bad
You’re just fighting the wrong battle
Here’s exactly what’s killing you (and the 3-step fix that actually works):
1)You open your charts pre-market
NQ already ripped 200+ points in London
You see the volatility and think:
“This is gonna EXPLODE at 9:30…”
2)Then… nothing
Dead chop for 3 hours
You’re buying and selling while price chops harder than prime Ronaldo on the wing
Account = toast
Here’s the brutal truth most retail traders refuse to accept:
Once the market has already hit (or exceeded) its 5-day Average Daily Range in the London session or pre-NY open…
The main move of the day is DONE
The tank is empty
Any “big move” left usually shows up in the evening session (earnings, news, or institutions reloading)
Markets don’t have unlimited juice in 24 hours
After a strong directional push → it accumulates orders → consolidates → then moves again
✅ Actionable checklist before you ever touch the open:
• Check London session range vs 5-day ADR
• If it’s already 80%+ of average… BE CAUTIOUS of the open
• Sit on your hands until 11am–12pm NY time or wait for the PM session
• Use that time to plan the REAL move (not chase the fake one)
Stop fighting exhausted ranges
Trade where the fuel actually is
Save this
Your next account will thank you
Here are the strongest draws on liquidity
These are the best levels you need to add to your charts
- Previous Day High/Low
- Asia session high/low
- London session high/low
- hourly swing high and low
- four hour swing high and low
there's a setup that appears on NQ every single day that most traders completely ignore because they're only watching one chart
here's the play:
NQ and ES move together roughly 90% of the time. when they diverge, when one makes a new high and the other doesn't - that divergence is one of the highest-probability reversal signals in futures
this is SMT. Smart Money Technique. and it's hiding in plain sight every session
the concept:
at 9:45am NQ sweeps the overnight high. new high for the day
at the same time ES attempts the same sweep. fails. doesn't make a new high
NQ made the high. ES didn't confirm it
that non-confirmation is institutions showing their hand. the NQ high is a liquidity grab, not a continuation move. ES is telling you the real direction - and it's not up
the NQ high becomes your entry short. stop above the sweep. target the sellside liquidity below
this works because:
retail watches one chart. they see NQ make a new high and think "bullish." they buy.
informed traders watch the correlation. they see NQ make a high that ES didn't confirm and think "liquidity sweep." they sell
every single day. same mechanic. different price levels
this one signal, on this one pair correlation, during this one session window, has a higher expected value than most traders' entire multi-setup, multi-session, multi-pair systems
and it takes about 30 seconds to check
how to use it:
step 1: have NQ, ES and YM open side by side. always.
step 2: when price approaches a session extreme (overnight high/low, Asia high/low, previous session high/low), watch all 3 charts simultaneously
step 3: if all 3 make the new extreme high - no divergence. no trade signal. wait
step 4: if one makes the extreme and the others fail - divergence confirmed. the failing chart is telling you the truth. trade in that direction
step 5: enter on the retracement. stop above the sweep on the chart that made the new extreme. target the opposing liquidity pool
one correlation. one check. 30 seconds of work. and it filters out the false breakouts that kill funded accounts
you don't need more setups. you need the one filter that tells you whether the setup is real
I teach the exact SMT divergence framework inside my free Discord. Live every morning with NQ and ES side by side. Real entries confirmed by correlation, not hope
Link in bio
🚨READ THIS - Suspicious Market Mechanics Explained
(Not Conspiracy, Just Facts)
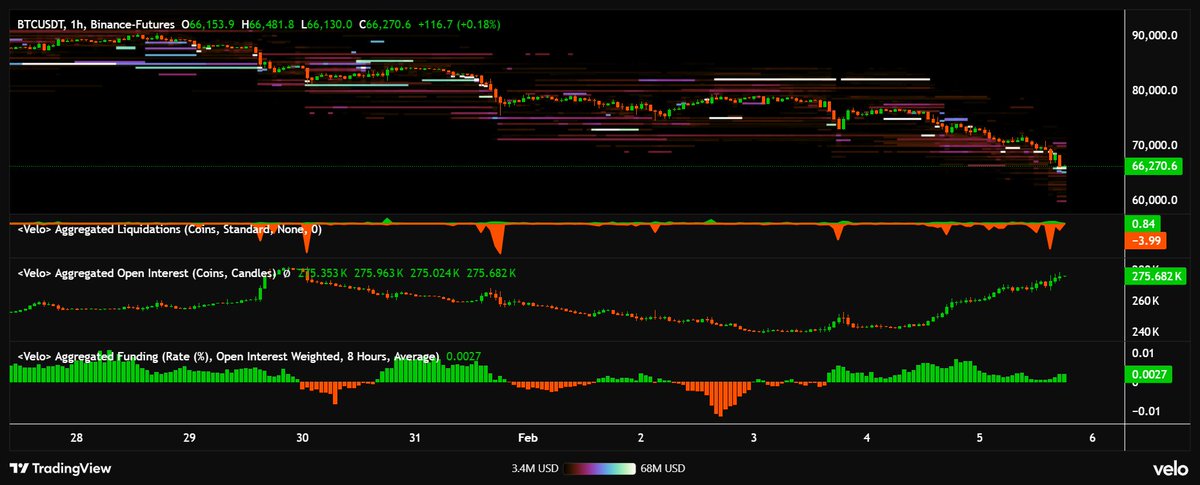
Something WEIRD is happening right now and most people are reading it wrong.
Here's what we're seeing:
Funding rates is still positive.
But we don't see new Longs being added.
Open going Interest is up. Price is down. So maybe many shorts being added. But why is funding still positive?
This feels like a dislocation in logic.
The Mystery:
Normally when funding and OI pump together, it means new longs are flooding in. But here's the thing - LONGS AREN'T REALLY BEING ADDED.
So why is funding still positive?
Because perpetual futures prices are trading HIGHER than spot.
When perp price is higher than spot price, long traders pay funding fees.
That's how the system keeps perps anchored to spot.
The Real Story.
If longs aren't pumping, where's the perp demand coming from?
PLOT TWIST: Maybe it didn't come from anywhere.
Maybe some exchange, some Whale slowly dumped DUMPED MASSIVE SPOT Bitcoin. Near about 2 billion in spot, sold TWAP. So the funding is positive not because there's a huge demand for perp but a constant unloading of Spot that's always done and being done.
We're talking around $2 BILLION USDT worth, sold via TWAP (Time-Weighted Average Price).
This crashed spot prices down while perps stayed higher, positive funding even though the market is actually BEARISH.
The Bottom Line?
This isn't manipulation. This is just what happens when someone moves size and doesn't talk about it. Could it be an exchange or a Whale using an exchange?
Context matters. Hence stop believe every influencer who posts charts with multiple indicators and uses Chatgpt to do the analysis. They have no context.
Thanks for coming to my no Conspiracy talk.