JUST IN: The $TROLL Face community on 𝕏 has surpassed 15,100 members, flipped the Dogecoin $DOGE community, and claimed #4 among all crypto (not just meme coins) communities on 𝕏, behind Bitcoin $BTC , Solana $SOL , and $XRP
✅ STRONGEST CAT COMMUNITY
✅50m TikTok views
✅4.5m Instagram followers
✅IP SECURED
✅CULT MEME
✅HYPER CONSOLIDATED CHART
Real cat posting SharkCat memes.
This is fucking it.
It will be too late for you, once the shark goes parabolic again. $SC
FZ Membership Giveaway
It's that time again.
Giving away 2x 3 month membership passes to my private educational hub - The Flow Zone.
Have already seen huge growth and both shifts in mindset and technical approach by group members.
Proud of all the progress they've made, and would like to see others take these steps forward.
To apply: like, comment and RT, and i'll be picking 2 winners by the start of next week.
Have a lovely weekend everyone 🤝.
I wanted to do a special thread today, talking about what I think is the most overlooked, underused and most valuable set of data in trading.
Imagine being able to see where the most influential market participants are stepping into the market, and having an insight into when they want to push it the other direction.
That is what delta allows you to see. If the basic volume histograms that most have at the base of their chart was replaced with a delta histogram, I believe traders would have a much easier time finding their footing and understanding what’s going on in front of them.
For me, it's the most important piece of data you can have alongside your price action charts. I’m not talking about delta in terms of options, I’m talking about having a second pair of eyes when looking at the charts, through which, you can see the relationships between market and limit orders, and how the market is being shaped by those that shape it.
Here's how it works:
▫️ Those that shape the market do so with limits. You may challenge this, but think about it. Do you really think if a large, experienced entity wanted to push the market in a certain direction they would be doing so via market? No, they absorb buys/sells from retail apes that are smashing market into their bids/asks, gently shaping the market in the direction of their intent by stepping in the way, where they please. They never operate in market form due to their size (slippage) and the respective fees.
▫️ When this occurs, and market orders move into limit orders, delta is produced.
▫️ That delta, is the only hard factual evidence we can have of what’s just occurred. Heatmaps are hearsay, where walls can be pulled, where delta is only produced after the fact. Delta is a critical element within footprint charts, named this way, because of the footprints they leave behind them. No predictions, no magic ball, no imaginary scenarios, no spoofing. - this is fact over thought data, of what has just occured.
▫️ When market buys move into limit asks – positive delta is produced.
▫️ When market sells move into limit bids – negative delta is produced.
▫️ So, for short confluence, we want to see +delta, and long confluence we want to see -delta.
▫️ Having the winds of delta at our backs when trading means we have the odds in our favour, as we are moving with the intention of the market.
All this theory is well and good but let’s take a look at this is practise.
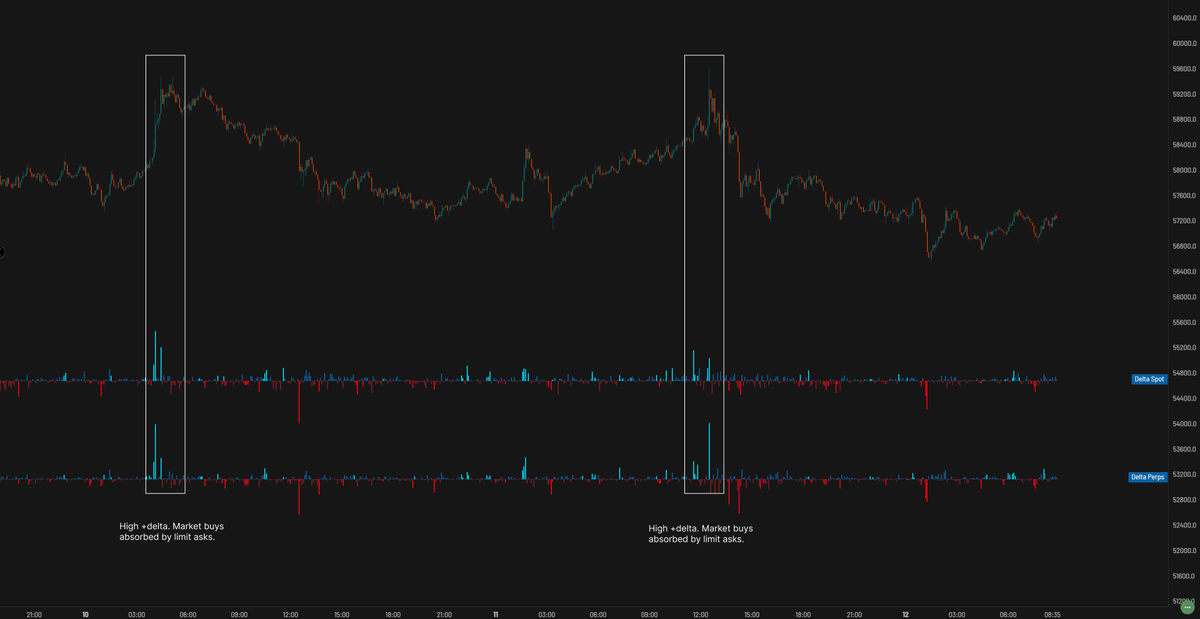
Here we have the last 2 days of price action laid out in front of us through the 5min timeframe. We can see, as clean as it comes, that when price pushes up into an area where there are asks, significant +delta is produced. Here we can clearly see the theory in action:
▫️ Market buys occur.
▫️ They push into asks.
▫️ Buying is absorbed.
▫️ Demand is exhausted, as buyers run out of steam.
▫️ Price stalls and rolls over.
So, how can we action this? Well to start I would advocate leaning heavily into the delta, but, still wouldn’t use it as a standalone tool. Instead, we use it in harmony with price action.
Although we are looking at the 5minute, this can be applied to other timeframes, I personally use aggregated delta histograms, up to the 4H timeframe, but let’s take a look at how the current example would be used in the sense of confluence.
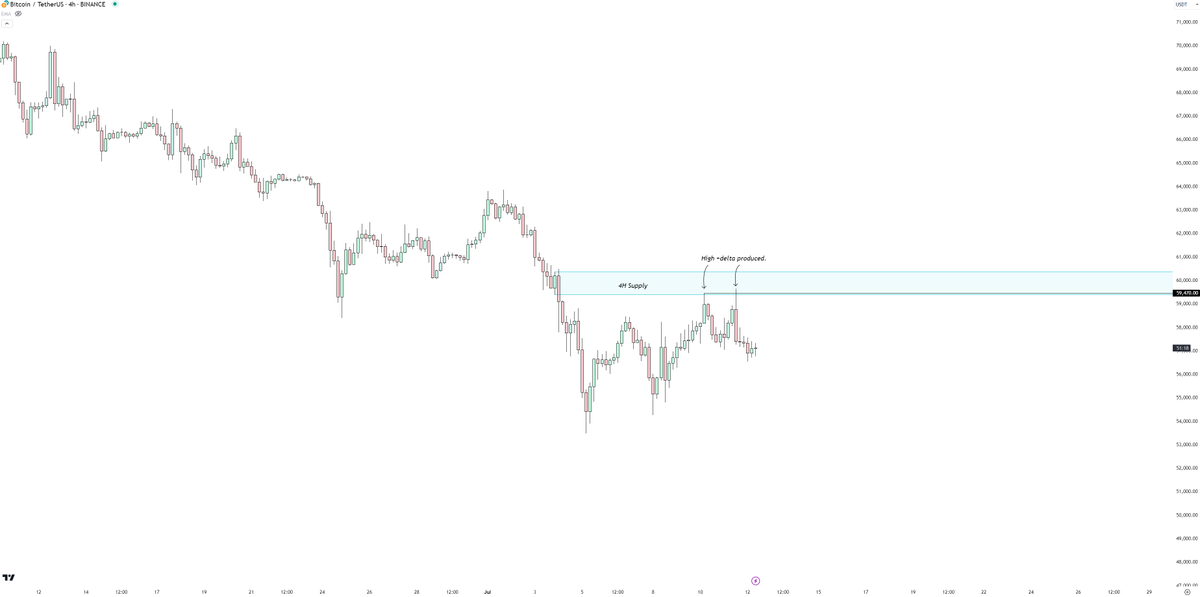
Here we can see that on the 4H chart, we have our newly formed supply. This acts as our main zone for confluence in the execution. Zooming down to the respective timeframe, in this case, 5min, we see the picture coming together.
The first cluster of +delta was produced in conjunction with a spike into 4H supply, and the RSI fully maxed out into overextension.
The second cluster of +delta was produced in conjunction with a spike into 4H supply, and a sweep of the high where the first cluster was produced.
Both, taking price action, and the delta into account, create a well thought out, confluenced trade thesis that can be actioned.
Now this is just an example using recent times, and elements of my PA system as confluence. You may use this in other ways such as:
▫️ Support and resistance
▫️ Divergences
▫️ Taps into liquidity zones such as supply or demand
Or any other elements in your system. Delta will fit as confluence to any of your strategies, and will give you that extra layer of confidence you need to execute with size, do so more aggressively (giving you tighter trades with higher R) and hold that trade through, based on the dynamics of the delta as the trade progresses.
We’ve spoken about reversion in the market, and seeing when limits are absorbing market orders, that pivot price in the opposite direction, but what if we’re not playing reversion trades such as a sweep, but instead continuation plays, such as a breakout?
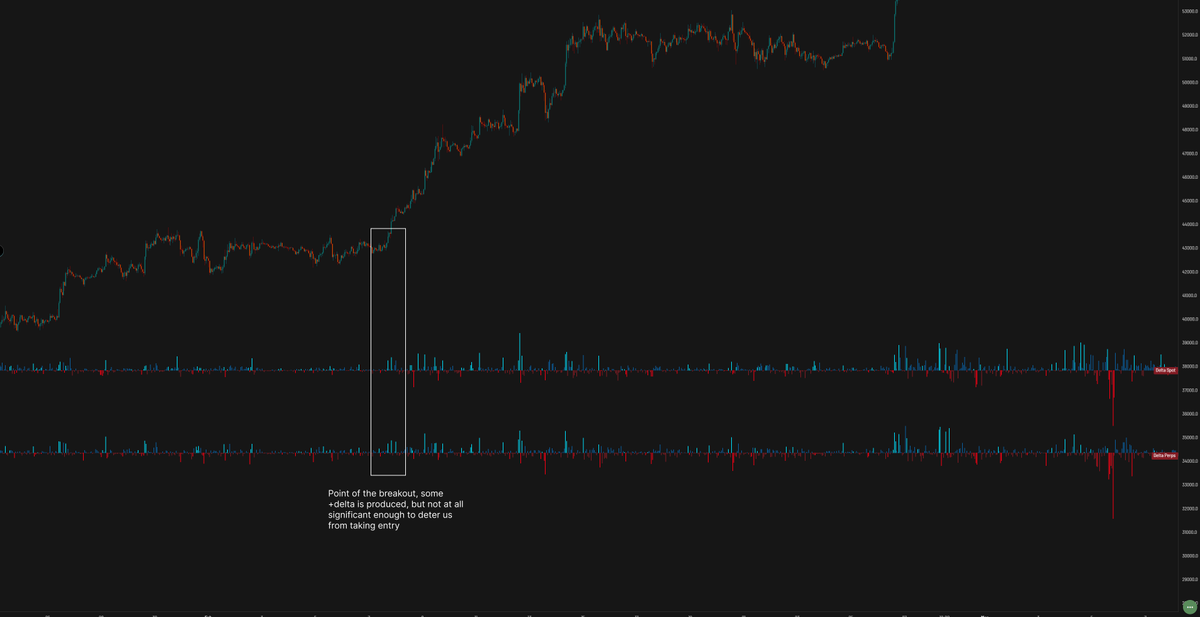
Well, in such instances, the delta is equally as helpful, but in these cases what we’re looking for is the absence of delta. Why? Because if we are to, say, break up past a key SR level, and we want to trade this breakout higher, we want to see a clear path for that to take place.
If significant +delta is produced on the breakout, what does this mean? It means there are limit orders suppressing the break, absorbing market buys, and getting right in the way of our breakout trade. So, for breakouts, we want to see thin delta, meaning we have little of limits in the way of the move, and we can successfully play a breakout to the upside, riding with the momentum of the trend.
Note: We will always have some delta produced, but the key is working out how much is some, and how much is too much. See the example here in February where we broke out of 43k. Some +delta was produced, but not very much, meaning, we’re still good to play this breakout to the upside.
All in all, this covers how useful the data set is, and hopefully an insight into how to use it in terms of execution. Personally, I couldn’t trade without it, you don’t need to learn how to use footprints if that’s daunting to you, a simple delta bar histogram will work very well. I use aggregated delta as it’s higher validity, but I very much recommend getting access to the data in some format. You’ll be shocked at how you ever traded before without it.
@Trader_XO@btc_charlie @cryptomemeduck Someone (Charlie) also said $wifai is 0 or 10x play and you should definitely bet the house on it.. 🤣
Might be a good time to load up because we’re definitely closer to that 0 lol
https://t.co/vuaV8e40uQ If you have never watched one of my livestreams, here is a 1hr one you can watch to get a very good idea of how I approach the markets.
If you HAVE watched my livestreams, and think other people should, give this a like and a retweet!
$BTC #Bitcoin
When I reach 50,000 followers. I’ll give $1,000 to someone who likes and retweets this, and is follower.
But there is a catch. I will dm the winner, and ask them a TA related question. If they don’t answer correctly, I will choose a new winner. Until someone answers correctly
9-5 vs Day Trading
When I was starting out, the thought of trading on a beach or trading whilst on holiday is what grabbed my attention.
What happened in reality was that I traded my 9-5 for a 24/7 endeavour.
The path to success is indescribably different to the glorification that most people on this platform propose.
To this day, I continue to spend most awakening hours on:
- finding ways to improve
- collecting statistics
- journaling & reviewing data
The purpose of this post is to attract awareness to the hardship and dedication needed to actually succeed in this field (at least from my experience) especially in relation to "day trading".
The goal as to what you can get out of this is still insanely amazing, but the work needed to actually get to that position is extremely overlooked and underestimated.
Put your head down and live it to the extent that is needed to succeed.
You are not trading a 9-5 for a 1 hour a day lifestyle, you are trading your 9-5 for a 24/7 ever perusing endeavour.