Educational pice action thread sharing some strategies for trend joining.
Here we're looking at $BTC on the lower time frames to snipe a range based trade using liquidity, weakening momentum & absorption as our foundation.
👇🧵
Harped on about this setup for months. Been a few failed breaks of late in equities, needless to say, if a setup this clean does the same - it truly is a risk off environment.
Been a minute but gonna go live this morning in a couple of hours.
11.30AM UK.
Markets are still relatively dry across both crypto and trad, but thought i'd share my take and my stance at current, and how i'm looking to position myself going forward.
Hope to see you there ☕️.
https://t.co/jjzbkRLw8a
Still hawking equities for swing long positions (breakout system only).
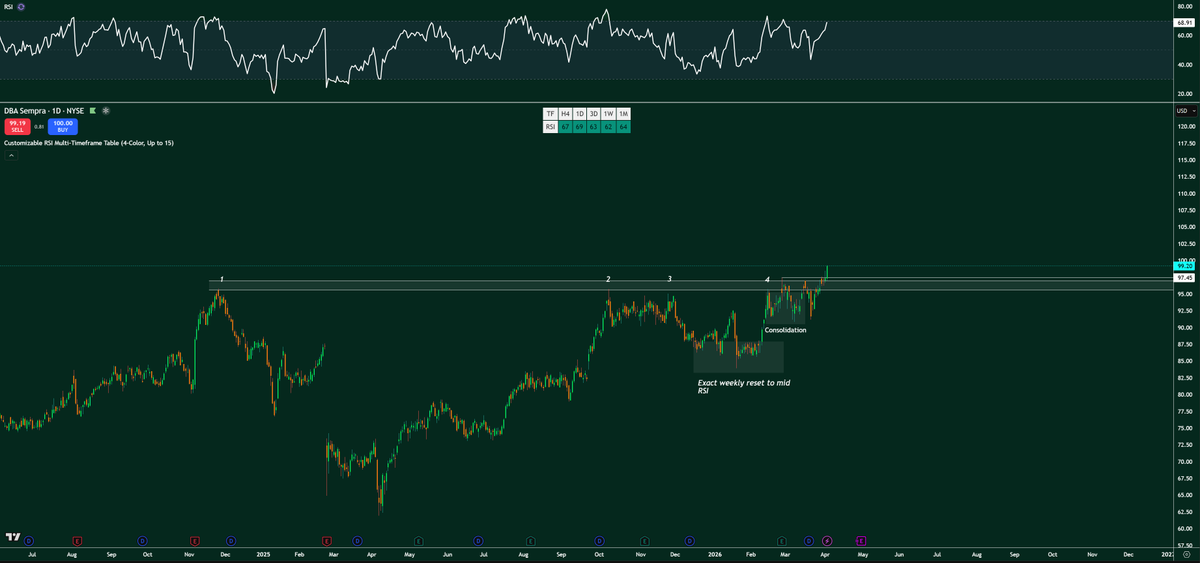
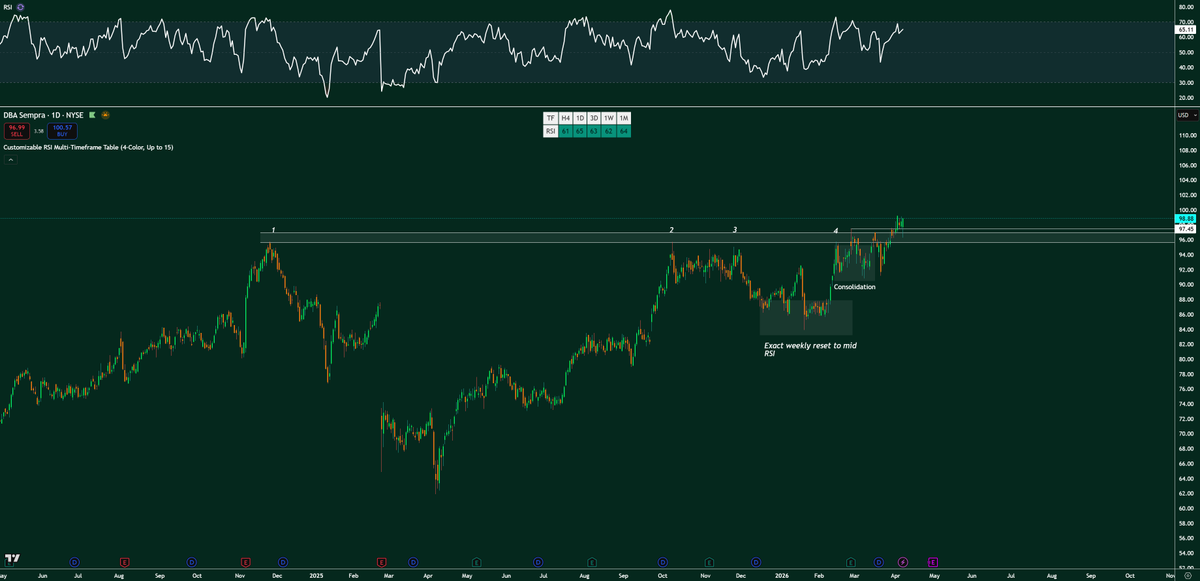
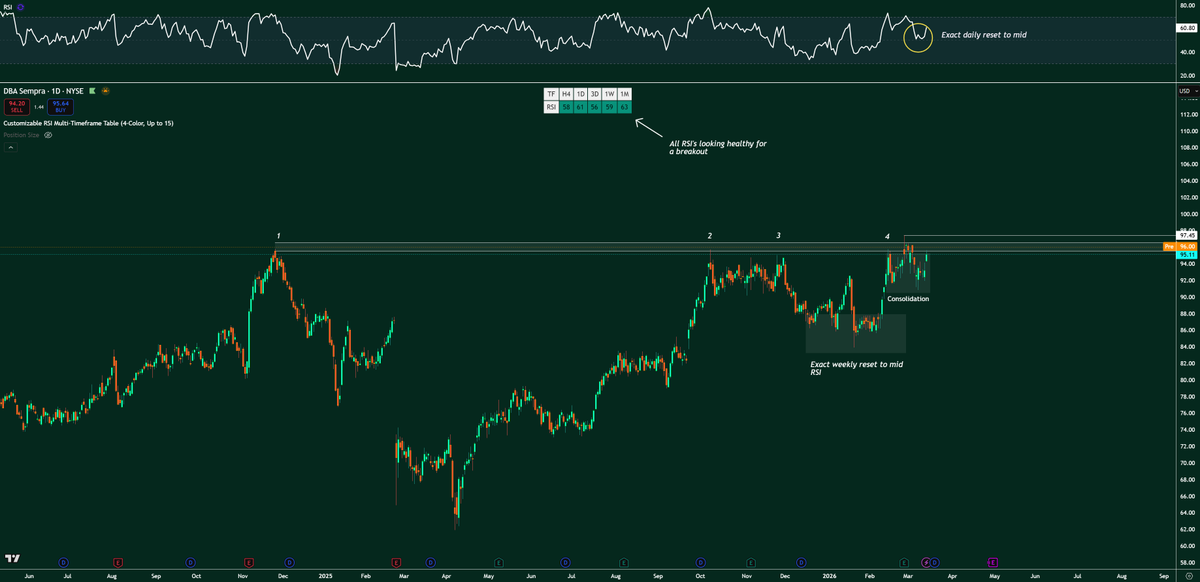
$SRE is exemplary in what i'm looking for, and as i'm now keeping a keen eye on the full S&P 500, there's usually a trade on the horizon, despite using the daily and 4H as timeframes for execution:
- A 4 touchpoint daily breakout level
- Consolidation prior to the breakout
- Daily RSI reset to mid, not a general one, but an exact double tap reset
- A weekly exact reset in the same manner to use as guiding HTF headwinds
- All RSI stats looking healthy (all between 50 and 70)
Why focus on bleak crypto charts when you have such beautiful swing setups forming on the equity side?
Going live tomorrow 10.30am.
https://t.co/4dRnLa0SgW
Running through my current take on the crypto market, and largely how i'm capitalising on the equities side of things. Come join me, the pastures are green.
If i started doing more 'trade execution' videos - i.e. screen records running through tradingview and showing you the recent trades i've taken in full detail (execution, thought process, exit rationale and approach) would that be useful to you all?
Remember, your biggest edge in trading is discipline. As long as your being patient and stringent, following your ruleset as you set out to, documenting the process, reiterating and refining, you are making progress. If you can't see it reflected in your equity curve, don't worry - it's a lagging indicator, the real alchemy happens within and that little green line you attach all your efforts to will catch up in due time. Trust the process..
Did a full scan of the S&P500 yday on stream, here's the link if you want to see my process in more detail.
https://t.co/GuN80FSufq
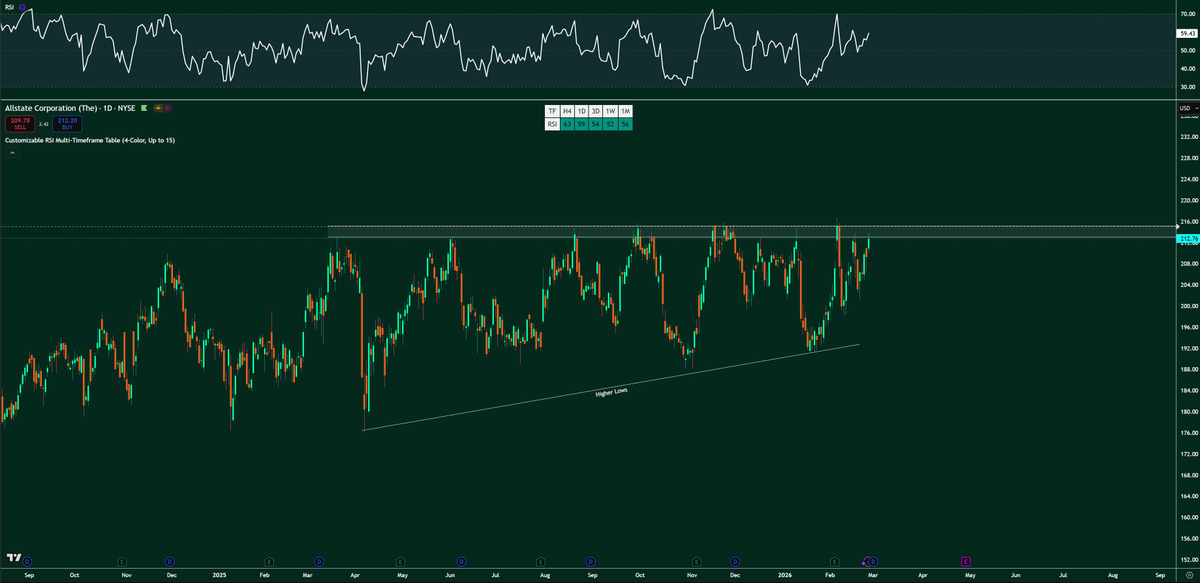
Am creating A,B,C,D,E watchlists which each comprise of 100 equities in order of descending marketcap going forward, will be scanning these daily - hunting for trend side triggers, in other words breakouts.
Have around 25 active setups that i'm stalking, some obscenely well structured charts such as this 9 touchpoint potential breakout setup.
Looking forward to really getting into it this year, thanks to all that are on the journey with me, let's make 2026 count.