Bitcoin Dominance is about to reach its peak.
Once that happens, we can expect altcoins to start pumping after Bitcoin has done its thing.
The black bar can remain in the overheated red zone for several days, which suggests that Bitcoin dominance is also likely to reach overheated territory on higher timeframes, making this an even stronger signal.
Bullish for altcoins.
Patience is key. ⌛️
bitcoin:native
📢New Indicator Alert: I proudly announce "The Finney Trail"
The Finney Trail is a highly complex VWAP-Anchored based cluster pattern that is being projected over a 3 day $BTC chart. It functions as a regime-aware channel + pivot-anchored VWAP system.📈
It builds a smoothed rolling median of typical price (HLC3) as the primary bull/bear divider. ATR envelopes are drawn around it. With the lock options enabled, the lower band only ratchets upward while price holds above the median (and the upper band only ratchets downward while price is below it). This creates a persistent, non-collapsing floor/ceiling that stays under/above price during a trend instead of oscillating through it. Inner dotted lines add visual thickness to the outer bands. It helps detect macro regime changes and meso-trend changes.🪢
Separately, it detects pivots and, while the regime is active, anchors a VWAP at the last relevant pivot (pivot low in a bear regime, pivot high in a bull regime). These are drawn as dotted polylines that trail forward from the anchor, accompanied by a running signed volume delta (up-volume minus down-volume). A break signal fires when price crosses the active anchored VWAP in the expected direction, labeling the accumulated delta volume at the break.🧮
I decided to name this indicator after Hal Finney. He was one of the earliest Bitcoin participants outside Satoshi, he ran the software almost immediately, received the first peer-to-peer transaction, and helped validate the system in its infancy. 👨💼
The name plays on that pioneer role: the indicator’s locked channels and pivot-anchored VWAP polylines literally draw and follow a “trail” of price/volume action from key pivots, only advancing in the direction of the prevailing regime. It is a technical nod to the path Finney (and the earliest OGs) established —blazing and then tracking the initial trail of Bitcoin itself. A true tribute to Hal and all early OGs🙏
Enjoy, fellas!🍿
All the best
Sheriff🤠
@xapa03 I’ll always go for xapa! I hope you carry on doing this brilliant work for a few more years. You’re a really lovely person – you can tell that as soon as you join your Discord server. Thank you so much!
Whenever this beautyful Oscillator is near the blue zone or touched the blue line, it was always a good entry for a long position.
We need to understand whether we are currently in a downtrend or an uptrend.
This is crucial, because even within downtrends, there are situations where the price touches the blue line, experiences a slight pump, and then continues to fall.
The current environment is defined by relentless bearish narratives and widespread FUD, with virtually no constructive news or positive catalysts being priced in, this is the trap.
Shorts are being allowed to build conviction and feel comfortable in their positioning, reinforced by the one-sided flow of information.
Once that positioning is sufficiently crowded, the squeeze begins.
Forced covering then drives the move higher, with Bitcoin targeting the 94k region as the next significant level.
The setup is deliberate.
The more one-sided the current sentiment becomes, the more vulnerable the shorts are when the squeeze is triggered.
Patience is the key. ⌛️
join XAPA's WORLD
https://t.co/6atyr1eq5F
bitcoin:native
🌞Good morning to y'all the People out there at the Bitcoin Frontier for another #MomentumMonday.
Sheriff here, with some brand new weekly chart data sets. Before we dive in, make sure to study my thread attached below in which I accurately correctly predicted this cycle's bear market bottom.🤿
Ready for those fresh weekly charts? Alright then fellas, sit back, relax, and enjoy this new week in $BTC.🧘♂️
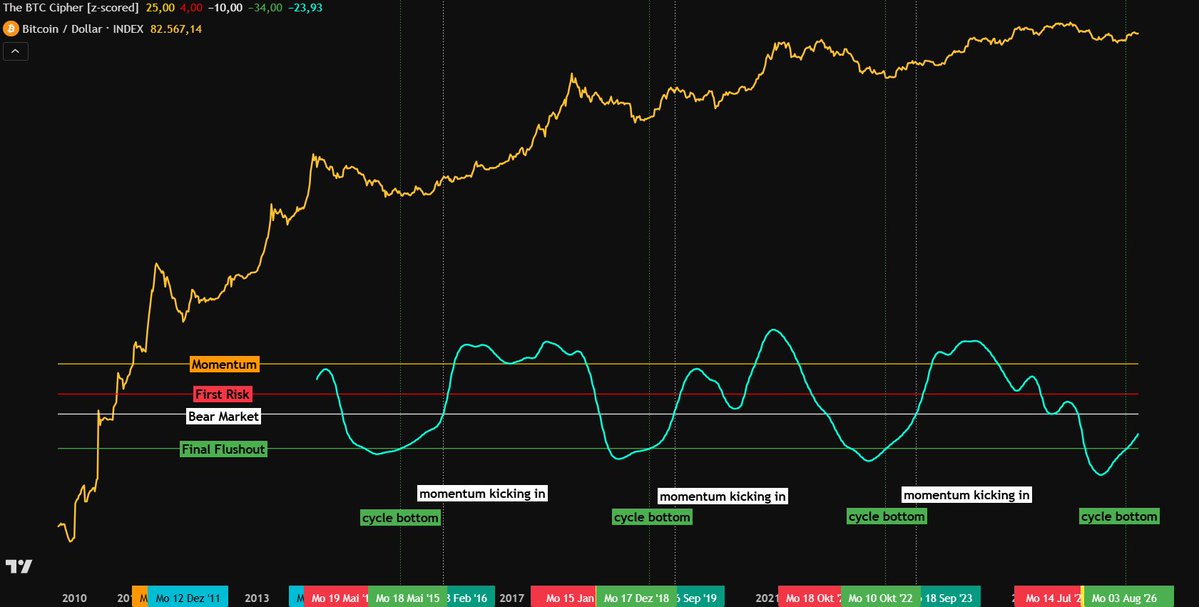
1) This week's Bitcoin Cipher data confirms last week's assumption of the "momentum" narrative. A steep incline in BTC Cipher hints to a clear momentum spark - my best guess will be Q4 2026 and translated into $BTC prices, true momentum will be kicking in with $BTC boldly confirming above the $90k-$94k cluster. Expect cooldowns in between, more on this in my weekly #ShortTermSaturday updates.📈
2) RCI 3L Sinus Strategy clearly shows a strong confirmation of the bottom being in and momentum gaining velocity. The stable sinusodial wave (red) trails as a constant pattern where the variable RCI3 Lines swing around in rhyming but allowable variable patterns. History doesn't repeat but it often rhymes!☑️
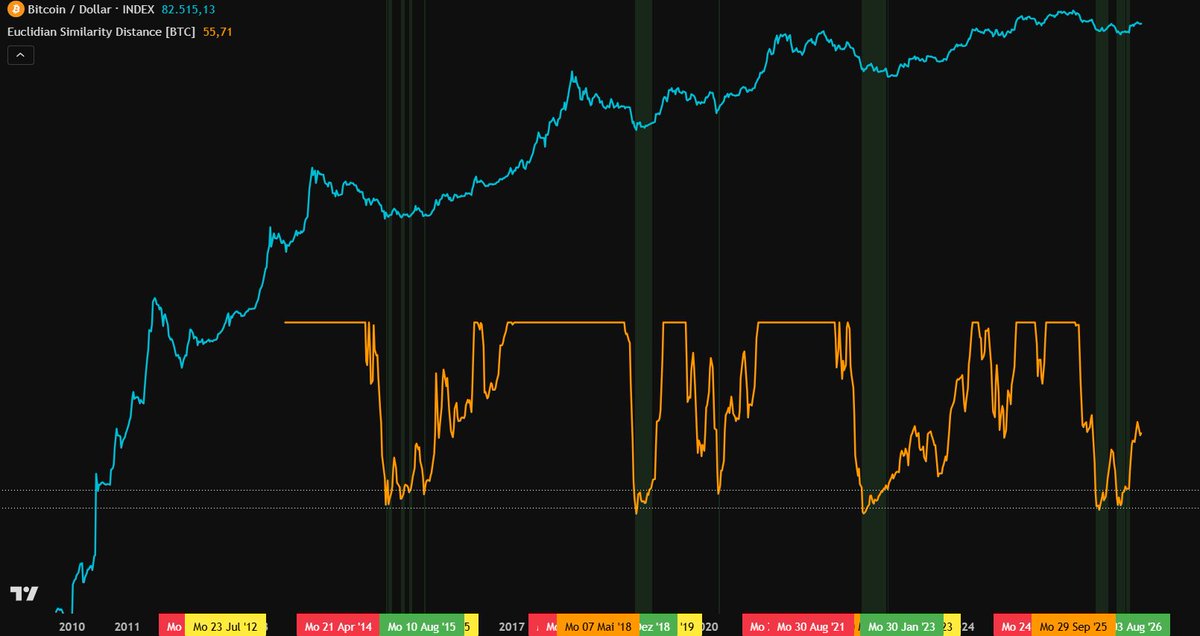
3) Euclidian Similarity Distance is a super sensitive Oscillator tracing its path dependancy in euclidian similarities. It has perfectly predicted bear market bottom zones. It also shows that we have barely moved from the bottom zone, meaning in meso-perspective we have plenty of room to go upwards before entering an overheated zone.🔥
4) Global Central Bank Liquidity Oscillator has given us THE PERFECT ENTRY liquidity-wise. Right now, we are reaching the first run-up above the red threshold, which does not have a significant relevance. It ONLY has huge relevance when it hits the red threshold post-halving. The next halving is set to be in Q1 2028, from there on, we will watch it consistently and we will monitor it like a hawk.🦅
Enjoy this #MomentumMonday update and attack the week.🤺
All the best🙏
Sheriff🤠
---------------------------------------------------------
⚠️DISCLAIMER: Not financial advice. All content is for informational and educational purposes only and reflects my personal opinion. This is not a recommendation to buy, sell, or hold Bitcoin or any other cryptocurrency. Crypto is highly speculative — you can lose all of your money. Past performance is not indicative of future results. DYOR. All decisions are your own responsibility. Consult a licensed financial or tax advisor if needed.
Welcome to final stage of these beautiful pattern.
The same bears who were still short last week before Monday are now long. ✅
The crowd missed the bottom and only now piles in at the top. ✅
First they flip the bears into bulls, then pump it over 83k so the latecomers know the bull market is officially confirmed, then dump it. ✅
Flip those same people who just turned bullish straight back into bears.✅- then pump it! ⌛️
Fear at the bottom turns into greed at the top.
Greed at the top turns back into fear at the bottom. Show up late and you get crushed in the middle.
The chart is not the problem, the herd’s timing is. 🎯
I am first watching the $88,000 to $89,900 zone.
Any rejection there is likely to be short-lived.
Support should develop in the mid $80,000s.
From there I expect a strong pump toward $94,000, with momentum extending toward $99,000.
Higher targets above $100,000 are marked on the chart.
bitcoin:native
#ShortTermSaturday - Episode 4 (10/17/26)
✒️My dear followers,
bang, bang y'all - we again nailed it! Good to see you here around kicking off your weekend with a great workout for your plebeian Bitcoin mind. It's going to be a lot of male astrology today, so make sure to lean back, take at least 15 minutes of your time, pick up your favorite drink and enjoy today's short term outlook for $BTC. 💣
In total, I have prepared three charts and one technical tool for you, let's dive into all of it:
1) The macro picture on a daily timeframe shows different outcomes in Bitcoin to me. You can observe a macro rising wedge (blue) which mostly turns to the downside. The final breakdown or breakout of this big setup is scheduled in Q3/Q4 2027. Within that rising wedge, $BTC will make its moves depending on the underlying meso market structure. Two likely scenarios are drawn in with yellow being the bullish one and red being the worst case bearish one. 🚨
If we assume that $79k-$81k cluster rn is the momentum bottom (I'll give you reasons for it in the second and third picture), we could tend to lean more to the yellow pattern playing out. 📈
If we get herd news and macro stuff that cancels out the rally, the worst case downside of that rising wedge would be found at around $72k to $77k trailing until the end of Q4 (not my base case scenario btw).📉
2) The second chart also shows you again the daily timeframe with BTC finding support at .786 fib of the respective movement from the bear market bottom which my friend @xapa03 and I accurately predicted in June/July 2026 up to the medium term local top at around $87k. Paralia is not green yet, which does correspond to a modest and decent upside if we were to break out from here (targets $90k-$96k roughly).🎯
3) In my third chart, I nearly overdosed on male astrology by drawing in a gazillion charts - jokes aside and try to be as focused as possible:
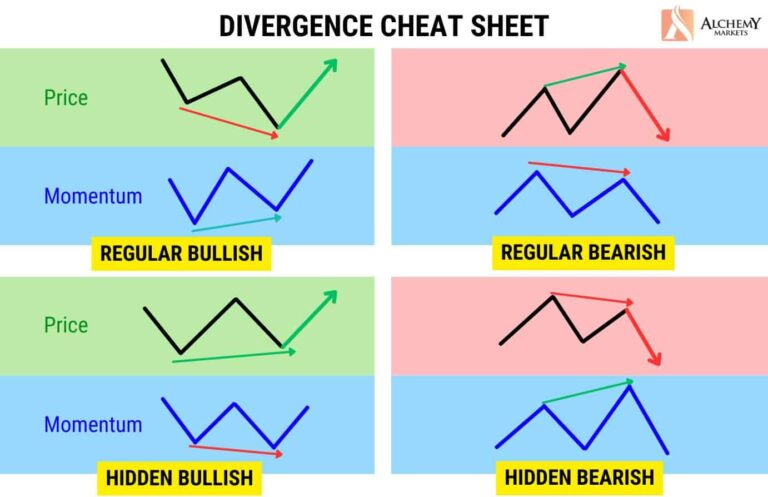
- hidden bullish divergence detected (also see picture 4)
- Paralia 12h organically and healthily green (buy signal)
- $BTC finding support at the 50d EMA while being pressed in a smaller micro falling wedge (yellow) which typically breaks out to the UPSIDE
- $BTC trailing in a meso falling wedge (dark blue) where we rn are in the middle of retesting it - retesting could drag us as low as $77k if we were to follow the purple prediciton of the Bitcoin price
- if we follow the yellow outcome and expect an early make it or break it in the beginning of November, we could end up breaking out and finding strong momentum supported by Paralia being healthily green and by the detected hidden bullish divergence
💡My best guess and my conclusion for the next 4-6 weeks is:
- we are right now establishing a healthy meso bottom zone in the $77k to $81k cluster
- we don't have to see $77k but if it was to break down, this would be an even greater entry
- $80k psychologically and technically is a great spot for a medium term bottom to be forming
- Paralia 12h, a hidden bullish divergence, and $BTC trailing in a falling wedge (yellow) give us good chances of a breakout to the upside
- targets to the upside are: $82.5k, $85k-$87k cluster, $90k and $96k
- targets to the downside are: $77k, $75k, and a worst case black swan cluster of $72k-$73k
⚠️DISCLAIMER:
Not financial advice. All content is for informational and educational purposes only and reflects my personal opinion. This is not a recommendation to buy, sell, or hold Bitcoin or any other cryptocurrency. Crypto is highly speculative — you can lose all of your money. Past performance is not indicative of future results. DYOR. All decisions are your own responsibility. Consult a licensed financial or tax advisor if needed.
Ethereum is on the verge of a historic turning point. After 2028 and 2029, the area below $3,000 will be history, a price we’ll only see in old charts and old memories.
The time when we could still call Ethereum cheap is coming to an end.
After everything played out perfectly and we hit the exact area of my drawn green box, I expect Ethereum to take off from here.
This was the moment we were waiting for.
The market delivered, the zone held, and now the next phase begins.
Not with hesitation, but with the calm of those who stuck to the plan.
See you next week. 🚀
ethereum:native
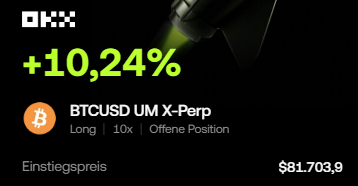
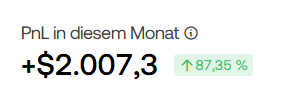
@xapa03 I have an average entry at 81.7k and am heavily long.
Xapa already predicted the perfect entry points on September 24. 🎯
86/87k -> short
Long from -> /79/80
I'm super grateful for everything; see you when it hits over 90k.
King! <3
Nailed every trade, tops and bottoms.
Did not expect to grow that fast, thank you for your support.
See you next week. 🚀
There is no siderline in XAPA's WORLD
join XAPA's WORLD
https://t.co/6Ws5lTFCXU
@xapa03 Once again, you nailed it perfectly—it’s an honor to be part of your community. A big shout-out to the @thebtcfrontierX, too, who played a huge role in making this happen. You’re making this year so much better for me and many others out there. It’s truly life-changing!!! Big W
@xapa03 I started trading two months ago and have been on Xapa's Discord for a month. His approaches are excellent, but never forget—these are just his thoughts, so never stop educating yourself.