Potential bottom for soybeans? 🌱 🤔
We’re sitting smack dab in the middle of the golden zone after giving back 50-61.8% of the August rally
A very common spot for a correction to subside
We had a huge volume gap to the downside the last few weeks. We sliced through it and are now back at an area of volume
We are also re-testing the highs from July
Soybeans have had a tendency to turn old ceilings into new floors this year
The August lows came at the March highs. Both the March and June lows came at the November highs
Would make sense to find some life here. However failure to hold this box would offer further downside
***
Want some help deciding when to pull the trigger in your grain marketing?
Try our updates + alerts free
👉 https://t.co/JvQ1KIpXXU
Our Sep 1st soybean sell alert: https://t.co/21JRAHDHJe
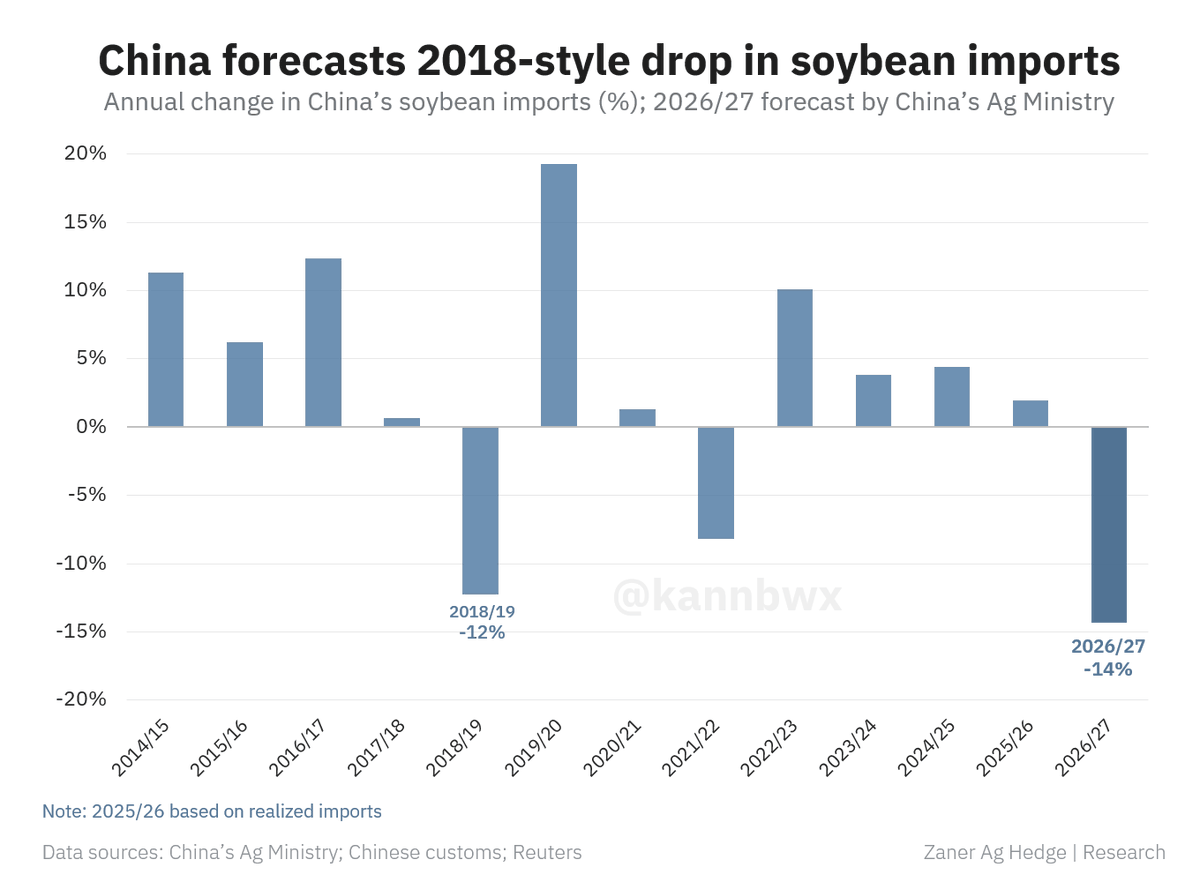
🇨🇳China's forecast implies a 14% drop in soybean imports in 2026/27, even steeper than the decline during the 2018/19 trade war and African swine fever outbreak.
What's going on, and what do actual demand indicators suggest? More in my Wednesday newsletter (linked in profile).
Where is the possible bottom for beans? 🌱
We broke some key support last week. As a result we’re the downside accelerate
As there was a huge volume gap to the downside
We are now quickly approaching a big area
The 50-61.8% retracements down to the August lows
This is also where volume picks back up after slicing through this volume gap
This range re-tests the July highs. Soybeans turn old highs into new lows pretty often
The August lows came at the March highs. Both the March and June lows came at the November highs from last year
Lastly, the last two sell offs in soybeans were around 90-95 cents. If this one is the same size it would also put us right in the middle of this box as well
If soybeans are going to bottom this box would be an area of interest to do so. As there isn’t much support below this area
***
Struggle knowing when to take risk off the table in grain marketing?
Try our updates + alerts free
👉 https://t.co/JvQ1KIpXXU
Our Sep 1st soybean sell alert: https://t.co/21JRAHDHJe
Very big change for beans origins CFR China. LY, zero US for SPONDJF window. Till last week, US accounts for 50% for this window. Arg and Brz lost 100 cargoes vs last year, same time.
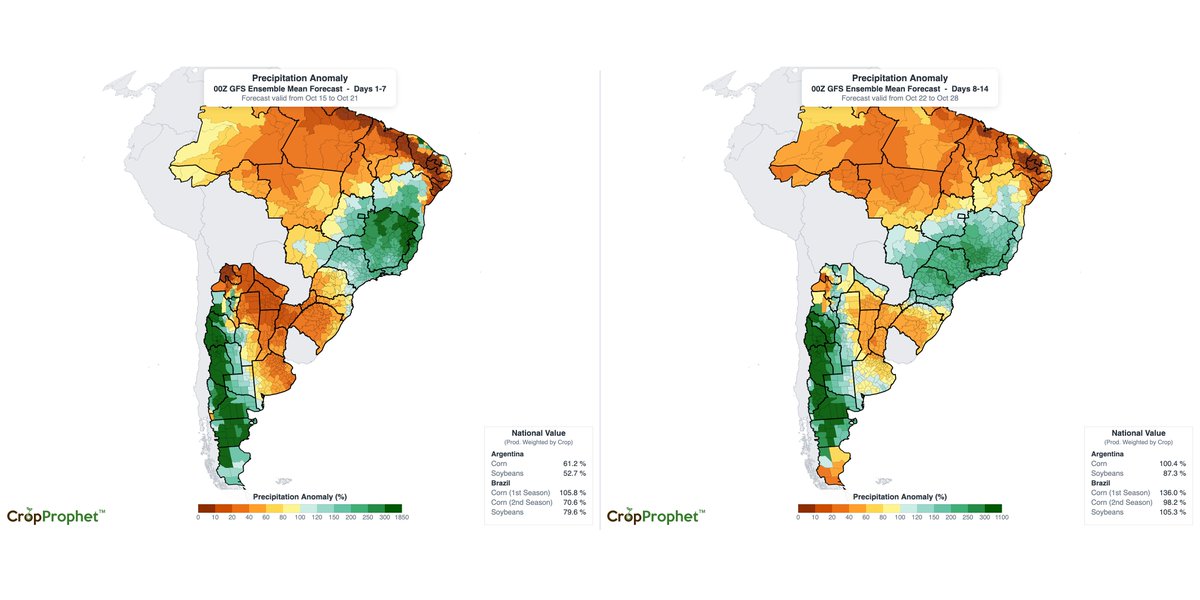
ECMWF, AIFS, and GEFS forecast substantially below-normal precipitation across Argentina's corn and soybean production regions in week two (Oct 26–Nov 1).
Argentina's corn production-weighted precipitation forecast for days 8–14:
• ECMWF: 72% of normal
• AIFS: 55% of normal
• GEFS: 54% of normal
Argentina's soybean production-weighted precipitation forecast for days 8–14:
• ECMWF: 58% of normal
• AIFS: 49% of normal
• GEFS: 46% of normal
Get a risk-free trial of CropProphet using the link in the comments below! 👇
#OOTT #AgWx #Corn #Soybeans #Argentina #GrainMarkets
@heartlandinves1@LorenDempster@BrianElsasser2 I was saying this a month ago. The bean yield will be close to 55. The corn yield results suggest close to 180, up from my ideas a few weeks ago. The drag in wcb is less than expected
Talked to the CEO of Germany‘s largest private grain trader.
He advises farmers to sell 80-90% of old crop wheat and 50% of new crop.
Due to his past as the global head of research of infamous Alfred C. Toepfer (nowadays ADM‘s analysis unit in Hamburg), he still is very much into the details of global grain markets.
His core argument:
🔸Wheat is 15% too expensive when purely looking at his fundamental model. The only reason prices are so high is because of the current Black Sea logistics issues
🔸Once there is a new grain deal, prices will correct sharply
🔸He is convinced there will be a grain deal. Re-routing grain via train from Ukraine to Poland or Rostov to St. Petersburg is costing enormous amounts.
🔸On-farm prices of below $3/bu (100/t) are putting immense pressure on Ukraine‘s and Russia‘s governments. Farmers don’t have financial buffers. Especially the large agro-holdings are on the brink right now because most of them are highly leveraged. Now interest rates went up while grain prices crashed.
🔸 Do both governments really wanna sacrifice their farmers? He doesn’t think so
🔸El Nino is still far away. Also, for grains it’s usually good due to better moisture in Argentina und Southern US (HRW). Only Australia would really suffer, but there it looks really good so far
🔸Only oilseeds suffer in an El Nino due to dryness for palm oil areas in Asia
🔸Wheat area goes down in Ukraine and Russia. But especially Ukraine has a history of planting much more corn and sunflowers when wheat planting struggles or they have winter kill.
Corn has double the yield of wheat.
How has soybean planting shifted across Brazil over the past 50 years, and why does it matter for weather forecasts?
In the 1970s, soybean cultivation was concentrated primarily in southern Brazil. Since then, soybean planting has expanded substantially into central Brazil, particularly Mato Grosso and Goiás, as well as other northern producing regions.
The attached maps and GIF illustrate how soybean cultivation has expanded and shifted geographically across Brazil over time, showing changes in the share of land used for soybeans.
With the ECMWF, GEFS, and AIFS forecasting below-normal precipitation in Mato Grosso over the next two weeks, rainfall across this region is important to monitor as Brazil's 2026/27 soybean planting season progresses.
This geographic shift in soybean cultivation also highlights the value of CropProphet's production-weighted weather indices, such as Brazil soybean production-weighted precipitation. These indices account for where soybean production is concentrated when aggregating weather conditions and forecasts, rather than weighting all geographic areas equally.
#OOTT #AgWx #Soybeans #Brazil #GrainMarkets #Soja
"The trade is focused on is not the forecast for El Niño two months out. It's what's going on right now." @StandardGrain
So, let's take a look at the precipitation forecast for Brazil soybean producing regions over the next 2 weeks.
Today's 00z Brazil soybean production-weighted precipitation forecast for week 1 (days 1-7):
• ECMWF: 107% of normal
• GEFS: 80% of normal
• AIFS: 77% of normal
Today's 00z Brazil soybean production-weighted precipitation forecast for week 2 (days 8-14):
• ECMWF: 123% of normal
• GEFS: 105% of normal
• AIFS: 105% of normal
#OOTT #AgWx #Brazil #Soybeans #Soja #GrainMarkets
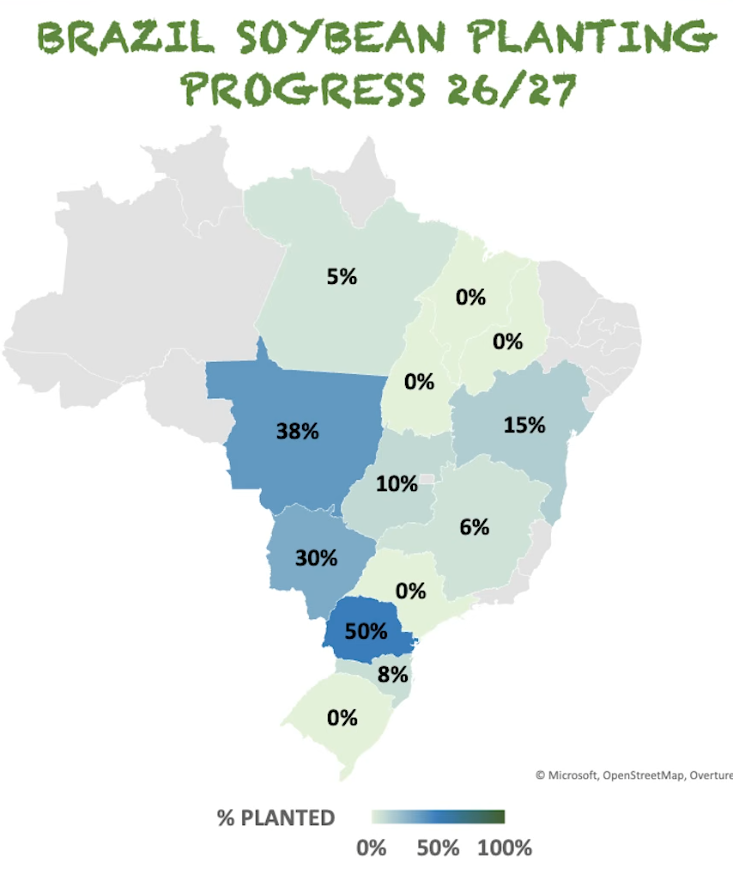
Moving along in Brazil. You can see where it is drier, progress is slower.
No major weather issue yet, but a bit too wet in southern Brazil.
Most forecasts see that as a trend that will struggle to end.......
🌱 Brasil: la siembra de soja alcanza el 20% del área, frente al 13% de igual fecha del año pasado, lo que anticipa una rápida incorporación de nueva oferta sudamericana si las condiciones climáticas acompañan.
They show a very wet push in the latter part of October, suggesting that the usual wetter trends for the southern half of the U.S. in an El Nino year "should" come into play.
We continue to strongly suggest that producers not dally on getting their crops out.
Brazil's soybean production has shifted north. Has its relationship with ENSO changed too?
In 1974, southern Brazil accounted for 87.5% of national soybean production. By 2024, that share had fallen to 27.5%, while the Center-West and North/Northeast together accounted for approximately 65%.
That geographic shift raises an important question when examining historical soybean yields and ENSO.
Comparing state-level soybean yield deviations from trend with the Jan–Feb Relative Niño 3.4 index reveals some notable differences:
• Mato Grosso, Goiás and Bahia: Since 2000, all three states have shown negative correlations with the ENSO index (r = -0.44, -0.32 and -0.37, respectively). Before 2000, their correlations were near zero or positive.
• Rio Grande do Sul and Paraná: Correlations have remained relatively weak in both periods.
• Nationally: Even when applying the 2024 regional production mix to every season since 1986, the correlation remains weak and is not statistically significant (r = -0.18, p = 0.26).
Brazil's soybean production has expanded into regions where higher ENSO index values have been associated with lower soybean yields since 2000.
However, through 2024, that regional pattern has not translated into a statistically significant relationship at the national level.
The maps show how Brazil's soybean-growing regions have changed since 1990, while the state-level comparison shows how yield correlations with ENSO differed between 1974–1999 and 2000–2024.
#OOTT #AgWx #GrainMarkets #Soybeans #Brazil #ENSO
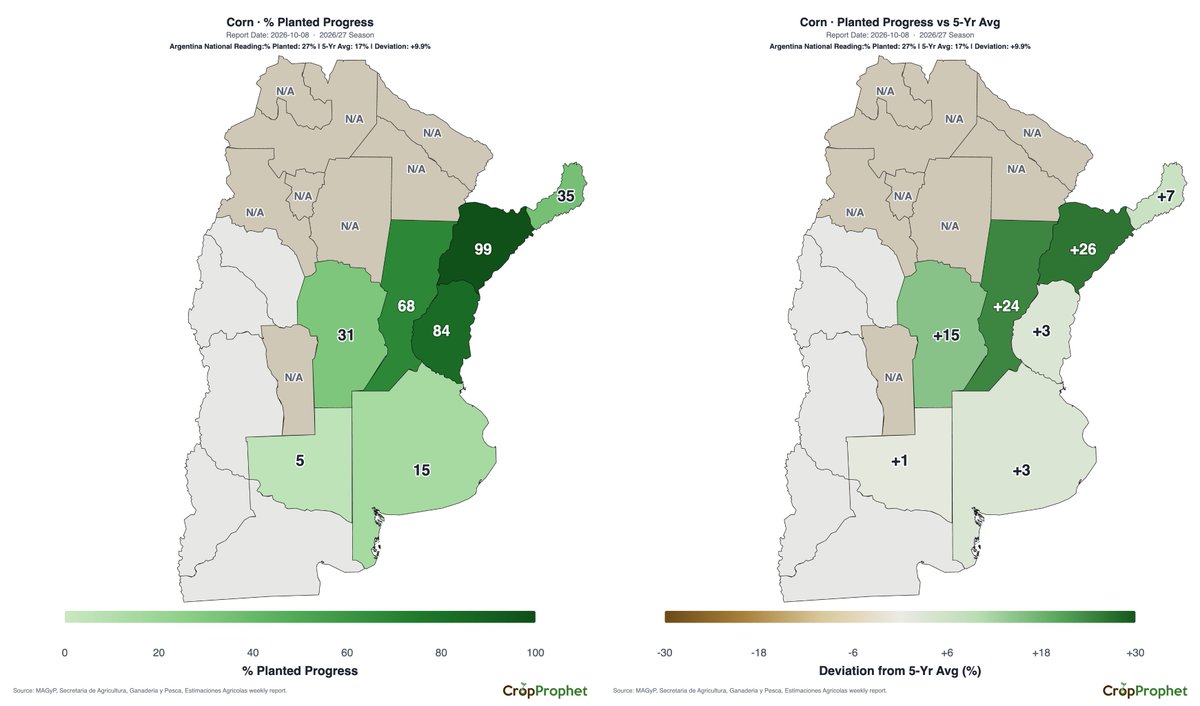
Argentina’s corn planting is running 9.9% ahead of the five-year average, with national progress at the 89th percentile.
As of October 8, planting for the 2026/27 season reached 27% nationally, compared with the five-year average of 17%.
How does planting progress compare across individual provinces?
• Buenos Aires: 15% planted | +3% vs. average
• La Pampa: 5% planted | +1%
• Córdoba: 31% planted | +15%
• Santa Fe: 68% planted | +24%
• Entre Ríos: 84% planted | +3%
• Corrientes: 99% planted | +26%
• Misiones: 35% planted | +7%
Santa Fe and Corrientes show the largest positive deviations from their respective five-year averages, while planting progress varies considerably across provinces.
#OOTT #AgWx #GrainMarkets #Argentina #Corn
Relationship between the soybean planting area and the vote in the first round in Brazil🇧🇷 where blue are where @FlavioBolsonaro received the most votes.
Agro Supports Bolsonaro
Agro Never Stops
O Agro Não Para