mlumr Playground: an interactive, browser-based app for unanchored indirect treatment comparisons
Unanchored indirect comparisons are increasingly common in health technology assessment (single-arm oncology trials, rare diseases, accelerated approvals), yet the mechanics of population adjustment are not always easy to convey. Multilevel unanchored meta-regression (ML-UMR), introduced by Conor Chandler and Jack Ishak at ISPOR Europe 2025 as an extension of Phillippo et al.'s multilevel network meta-regression (ML-NMR), adjusts populations by integrating an individual-patient-data outcome model over the comparator's covariate distribution.
To support teaching and intuition-building around the method, we developed a lightweight, browser-based playground. It runs entirely client-side via WebAssembly (no installation, no server, and no data leaving the browser), using the same Stan models that underpin the mlumr R package.
Capabilities:
✅ Load index IPD and comparator aggregate data, and specify the comparator covariate distributions used for quasi-Monte Carlo integration.
✅ Work across the three outcome families: binary (logit/probit/cloglog), continuous (identity/log), and count (log), under both the SPFA and relaxed model variants.
✅ Inspect convergence interactively (parallel chains, trace and rank plots, R-hat, ESS).
✅ Examine marginal effects (for instance, odds ratios, mean differences, and rate ratios) in both the index and comparator populations, including the collapsibility behavior of each estimand.
The playground also offers an early preview of time-to-event support, currently in development for a future release.
Intended scope: this is an educational tool with deliberately light defaults for responsiveness. It is designed to build understanding of the method, not to generate analyses for submissions or decision-making. For applied work, the validated implementation is the mlumr package, available on CRAN: install.packages("mlumr").
New on CRAN – mlumr: Bayesian multilevel unanchored indirect treatment comparisons in R
In health technology assessment (HTA), many times there is no common comparator between two treatments of interest. This is fairly common in oncology, rare diseases, and accelerated approvals in which many trials are single-arm. Matching-adjusted treatment comparison (MAIC) and simulated treatment comparison (STC) are common techniques for unanchored situations where each has trade-offs.
Multilevel unanchored meta-regression (ML-UMR) was introduced by Conor Chandler and Jack Ishak at ISPOR Europe 2025. ML-UMR extends multilevel network meta-regression (ML-NMR), developed by Phillippo et al., to unanchored settings. ML-UMR adjusts populations by integrating an IPD outcome model over the comparator’s covariate distribution (using Sobol sequence quasi-Monte Carlo (QMC) + Gaussian copula). This way, both IPD and aggregated data can be modeled in the same regression model.
Now, we are proud to announce that mlumr R package has been released.
This package comes with:
✅ Two model variants: Shared prognostic factor assumption (SPFA) and relaxed (treatment-specific prognostic factors).
✅ Three outcome families: Binary (logit/probit/cloglog), continuous (identity/log), count (log).
✅ Marginal and conditional effects in either index or comparator population.
✅ Model comparison (LOO/WAIC/DIC) and prior_sensitivity() for relaxed models.
✅ STC (using G-computation) and naïve benchmarks.
✅ Two engines: RStan by default, optional CmdStanR backend.
It’s free software, licensed under GPL-3, and on CRAN today:
install.packages(“mlumr”)
References:
- Gelman, A. and Hennig, C. (2017), Beyond subjective and objective in statistics. J. R. Stat. Soc. A, 180: 967-1033. https://t.co/MgSvKMXPyB
- Weinberger, D. (2009) Transparency is the new objectivity. Everything is miscellaneous blog, July 19th. (Available from https://t.co/jEkOFOFTJ6)
- Botvinik-Nezer, R., Holzmeister, F., Camerer, C.F. et al. Variability in the analysis of a single neuroimaging dataset by many teams. Nature 582, 84–88 (2020). https://t.co/sGbp26EEn9
Transparency is the new objectivity.
David Weinberger (in a 2009 blog post, cited in Andrew Gelman and Christian Hennig's paper "Beyond subjective and objective in statistics") argues that objectivity functioned as a trust mechanism for a medium that couldn't easily show its workings. If a journalist claimed to be "objective," readers often had little choice but to accept it, as following sources or assumptions was costly and time-consuming. In that setting, objectivity served as a kind of stopping point: you had reached a credible source, and the inquiry could reasonably end.
That model made sense for the paper. It’s less clear that it works as well now.
Gelman and Hennig make a related point for statistics. The labels "objective" and "subjective" don't do as much useful work as we might hope. In practice, they often obscure the real issues: what assumptions were made, how sensitive the results are, and how alternative choices might change conclusions. Instead, they suggest focusing on more concrete qualities: transparency, impartiality, stability, awareness of multiple perspectives, and alignment with observable reality.
There's also empirical support for why this matters. In a large "many analysts" study, Rotem Botvinik-Nezer and colleagues (2020) gave the same dataset to dozens of independent teams. No two teams used identical pipelines, and their conclusions often differed (sometimes substantially) despite analyzing the same data. That kind of variability is hard to reconcile with the idea that any single analysis is simply "objective."
Seen this way, some familiar practices look a bit different:
- A "default" prior (in Bayesian statistics) isn’t neutral; it's a choice that can be explained (or not).
- A p-value depends on modeling decisions, stopping rules, and reference sets.
- Even frameworks designed to minimize judgment still embed assumptions.
None of this invalidates these tools, but it does suggest that calling them "objective" may not be the most informative description.
What seems more useful, at least in many cases, is making those choices visible:
- What assumptions were made?
- What alternatives were considered?
- How sensitive are the results?
- What would change under different reasonable decisions?
Transparency doesn't remove bias or disagreement. But it gives others a way to understand, critique, and, if needed, re-run the reasoning.
So perhaps "transparency is the new objectivity" is less a replacement than a change in emphasis: Not "trust this because it’s objective," but "here’s how this was done; see for yourself!"
It’s a more demanding standard, and probably an ongoing one rather than a box to check.
The genocidal Israel regime has imposed a brutal digital blackout on Gaza for 44 days, cutting off millions from the world, silencing voices, and piling up human & economic suffering. Where is the outrage from the UN and human rights groups? 😡
P.S.: Now that I have your attention, replace 'Israel' with 'Islamic Republic of Iran' and 'Gaza' with 'Iran'. The longest internet shutdown in a connected society is happening right now — but crickets from the usual crowd.
⌛️ Network data show #Iran's internet blackout is now in its 44th day, continuing in its seventh week past the 1032 hour mark.
The human and economic impacts of the extended censorship measure continue to pile up, breaking global records for shutdowns in a connected society.
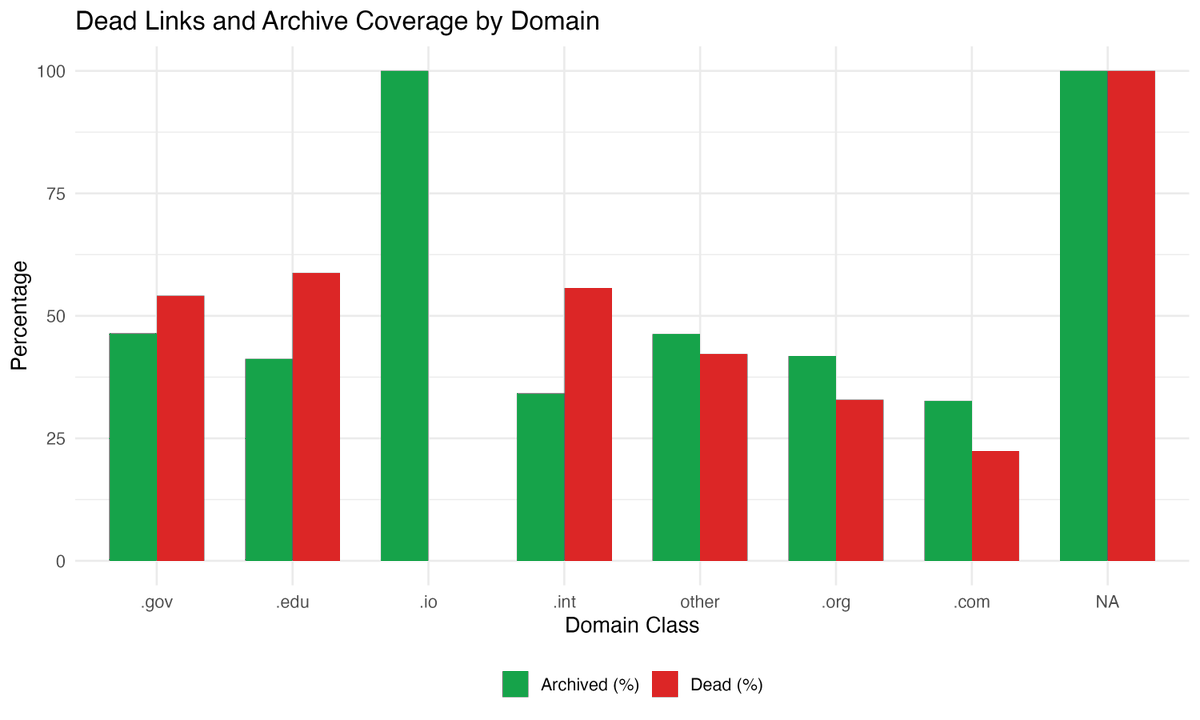
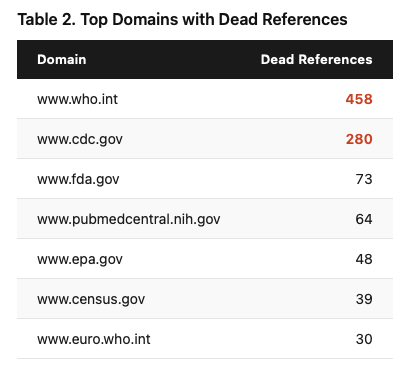
I checked 17,776 web links cited in 27,000 biomedical research articles.
29% are dead.
The worst offender? The @WHO website: 458 broken references. CDC was second with 280. These aren't obscure blogs. They're the most authoritative sources in global health.
For citations from 2002–2004, the dead link rate exceeds 78%.
Even when the link still works, 27% of the time the page content has silently changed. The URL loads fine, but the evidence behind the citation is gone.
And here's the part that should concern everyone in research: 64% of dead links have no Internet Archive backup. The cited content is permanently lost from the scientific record.
The fix? It takes 30 seconds. Before you submit, paste your web references into https://t.co/Ihvx25NMEh. You get a permanent, timestamped snapshot. Add that archived URL to your reference list. Done.
We obsess over data sharing, pre-registration, and reproducibility, but we let the evidentiary foundation of our references quietly disappear.
I wrote up the full analysis with all the data and figures. Read it here: https://t.co/ggbzwbmc80
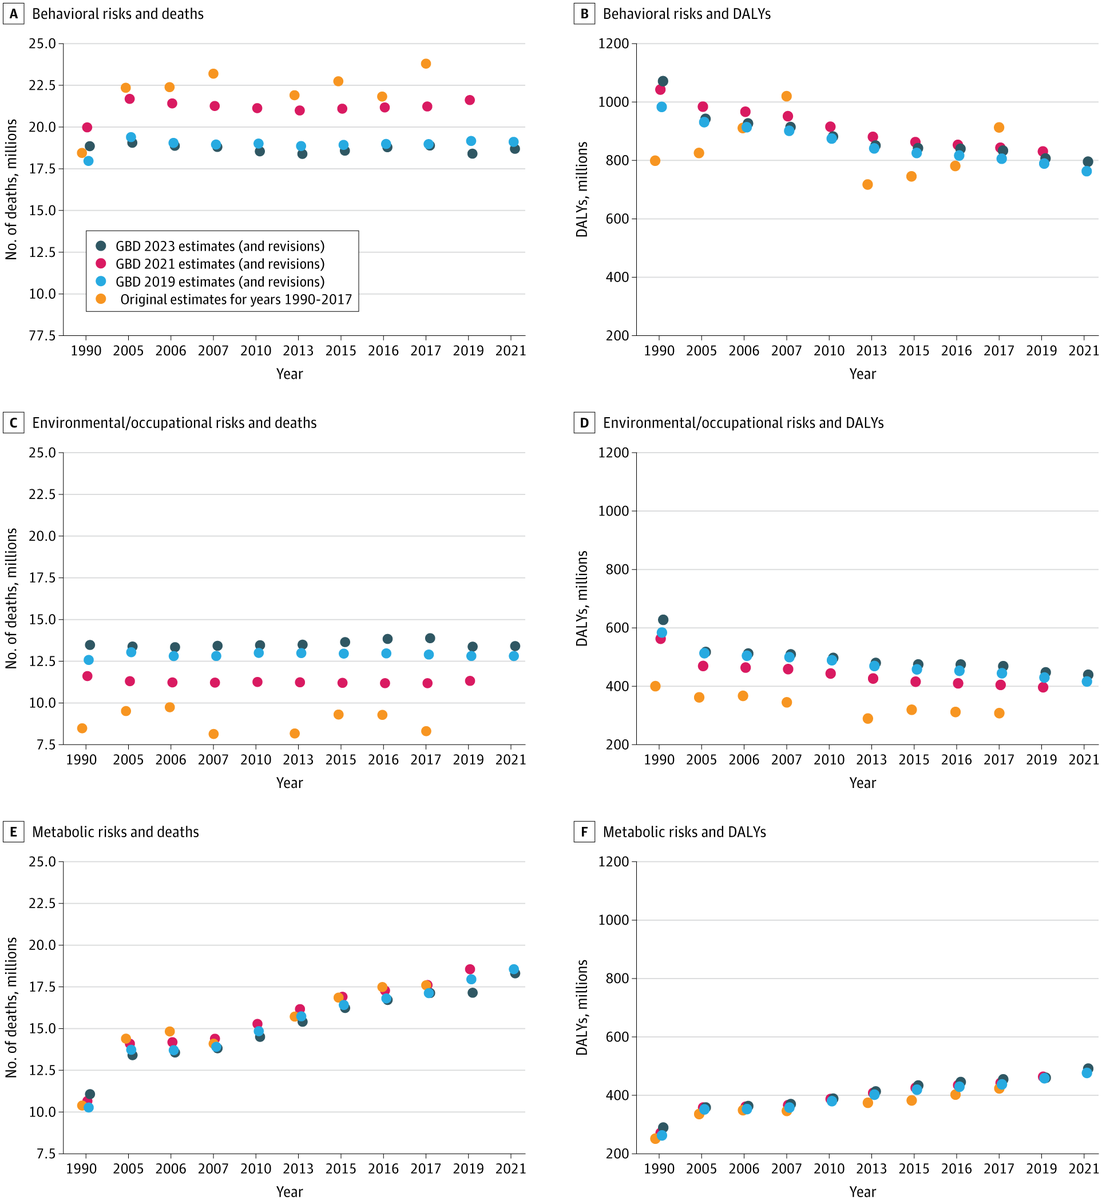
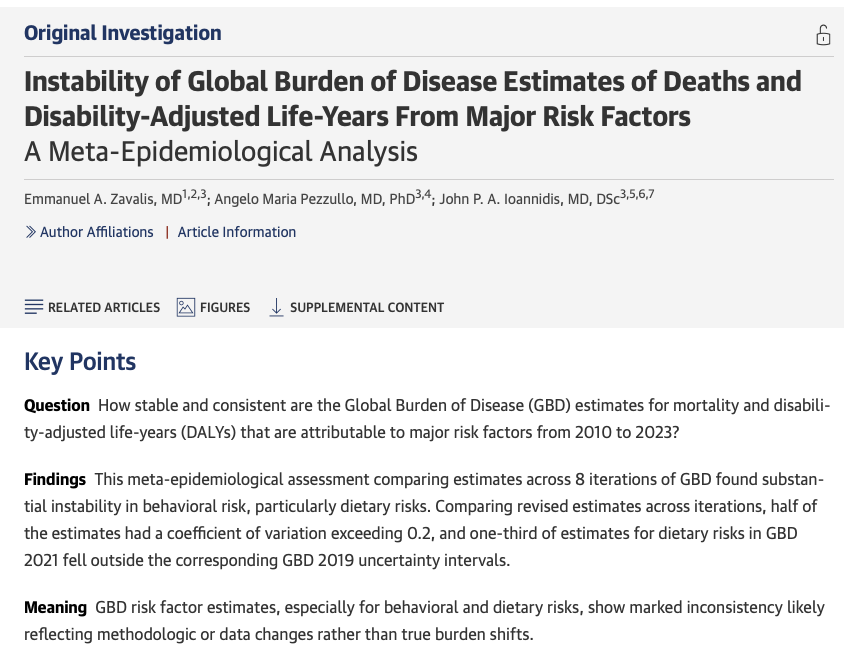
Someone finally did the study.
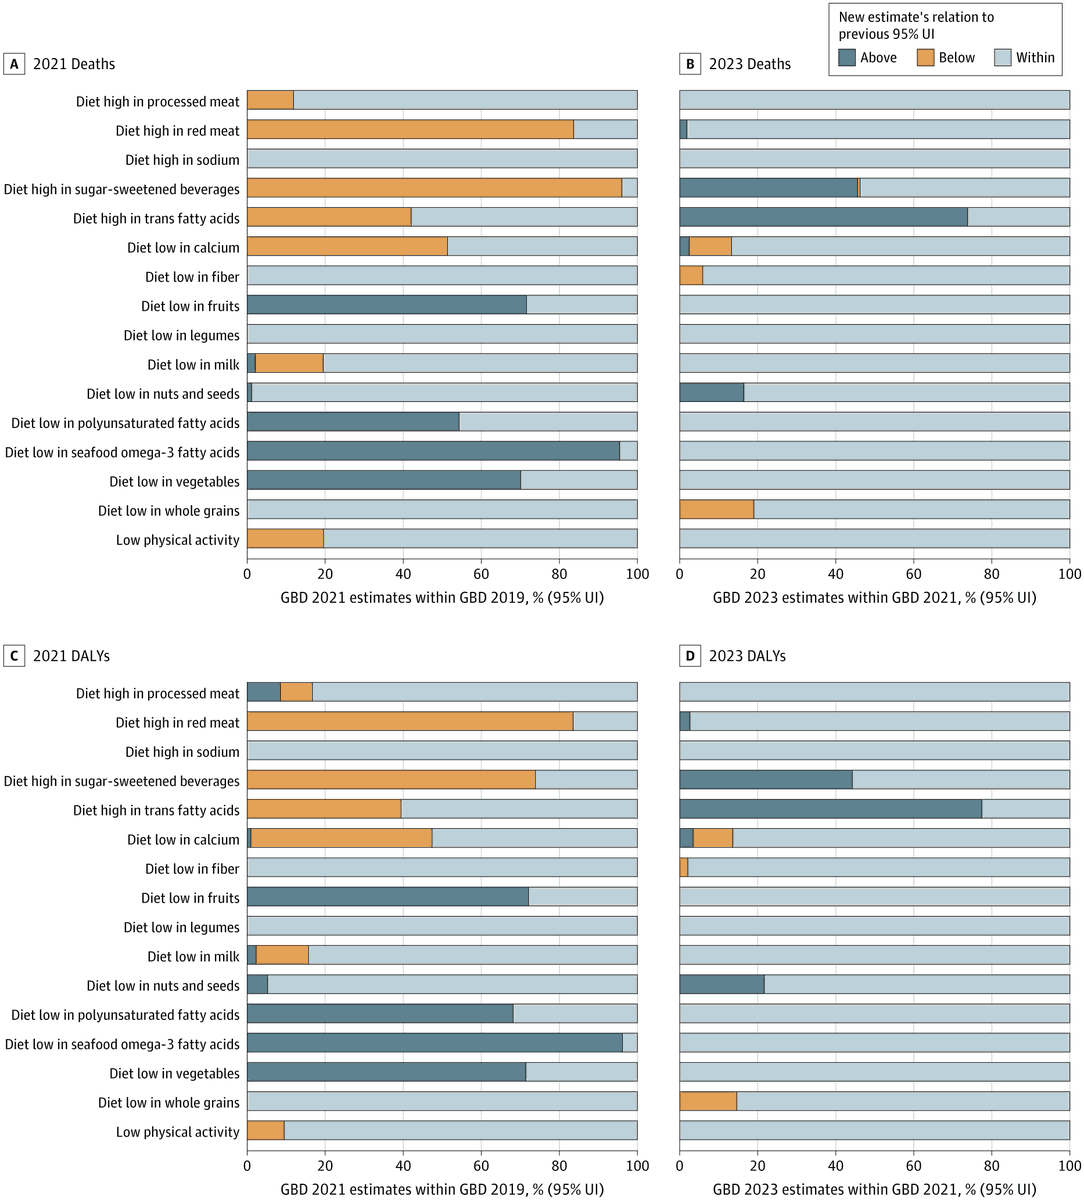
A paper just published in JAMA Health Forum said something many of us who work with Global Burden of Disease (GBD) data have quietly wondered: how stable are these estimates, really?
Zavalis et al. (2026) compared GBD risk factor estimates across 8 iterations from 2010 to 2023 and found substantial instability (particularly for behavioral and dietary risks). Half of the death estimates had a coefficient of variation exceeding 0.2, and for some dietary risks, 70–96% of GBD 2021 point estimates fell outside the GBD 2019 uncertainty intervals. That's not noise, that's a signal worth taking seriously.
As someone who has published multiple Quality of Care Index (QCI) papers using GBD data (covering oral disorders, lip and oral cavity cancer, and orofacial clefts), I think this paper deserves an honest read from anyone in our field.
To be clear: GBD remains one of the most ambitious and valuable epidemiological projects ever undertaken. The team should be credited for continuously updating and improving their methods, and for making the data publicly available in a way that enables studies like this one.
But this analysis is a useful reminder that GBD-derived indices, including QCI, reflect the data and methodology of a specific iteration. When the underlying estimates shift substantially between versions, our conclusions may shift too, even without a single new patient being diagnosed or treated.
What does this mean in practice?
— Interpret QCI trends with appropriate caution
— Be explicit about which GBD iteration you used
— Treat uncertainty intervals as a floor, not a ceiling
— Consider sensitivity analyses across iterations where feasible
I'm glad someone finally did this study systematically. It doesn't invalidate GBD-based research, but it sharpens the conversation about what we can and cannot confidently conclude from it.
https://t.co/TvaKML5RoJ
Whereas retractions usually expose scandals in science, citations to retracted articles are a bigger scandal, especially when they are post-retraction.
Based on my analyses of the @RetractionWatch Database and citation data from @opencitations and @OpenAlex_org, I found out that of one-third of citations to ~63K retracted articles occurred post-retraction. Precisely, 261,380 post-retraction citations.
"Visfatin: a protein secreted by visceral fat that mimics the effects of insulin", published in Science in 2005 and retracted in October 2007, has the highest number of post-retraction citations, 1,321 out of 1,595 (~ 83%). The latest citation was from an article published in March 2025.
This unfortunate phenomenon has largely been due to a lack of connection between retraction data and reference managers. Zotero and Mendeley launched this initiative long ago, and fortunately, in July 2025, EndNote joined as well.
XeraRetractions web app: https://t.co/j9xbvLHRIx
Estimating Deaths in the 2026 Iran Protests Using Quantitative Bias Analysis
With Iran under a complete internet blackout since January 8, 2026, accurate death tolls from the ongoing protests are nearly impossible to verify. Iran International reports 12,000 deaths, but how reliable is this figure? Based on my lived experience in Iran and the news and videos, I thought it's too conservative.
Therefore, I built an interactive tool (link in the first comment) that estimates true mortality using Quantitative Bias Analysis (QBA), a systematic method for adjusting epidemiological estimates when data sources have known/unknown biases.
The anchor point: Ghafari et al. (2021) analyzed Iranian civil registration data and found 6,040 excess deaths (95% CI: 3,480–8,600) during the November 2019 protests. This was 4x higher than Reuters' estimate of 1,500, meaning media reporting captured only ~25% of actual deaths even before the current blackout.
The model:
Estimated Deaths = Baseline × Geographic Factor × Duration Factor × Intensity
- Baseline uncertainty: Sampled from truncated normal distribution using Ghafari's 95% CI
- Intensity multiplier: Triangular distribution (min=0.5, mode=2.0, max=10.0) reflecting uncertainty about violence severity relative to 2019
- Reporting sensitivity: Trapezoidal distribution (10%–35%)—the flat region (15%–25%) represents equally plausible values, with linear tails capturing extreme scenarios
Why these distributions? Triangular is ideal when you have a most likely value but uncertain bounds. Trapezoidal allows a range of equally likely values rather than a single mode, more realistic when we genuinely don't know if sensitivity is 15% or 25%.
Results: 10,000 Monte Carlo iterations propagate uncertainty through all parameters. At moderate intensity (2x 2019), the median estimate is ~77,000 deaths (95% CrI: ~20,000–300,000). The wide interval reflects genuine uncertainty, not imprecision.
Interpreting the 12,000 figure: If reporting sensitivity is 10–25%, the true death toll implied by Iran International's count is 48,000–120,000.
Limitations: Linear scaling assumptions, geographic homogeneity, and subjective priors. This demonstrates QBA methodology applied to crisis estimation, not a definitive count.
Link to the app: https://t.co/sCFmTLOkOs
#Iran #HumanRights #Epidemiology #QuantitativeBiasAnalysis #QBA #MonteCarlo #BayesianInference #IranDigitalBlackout
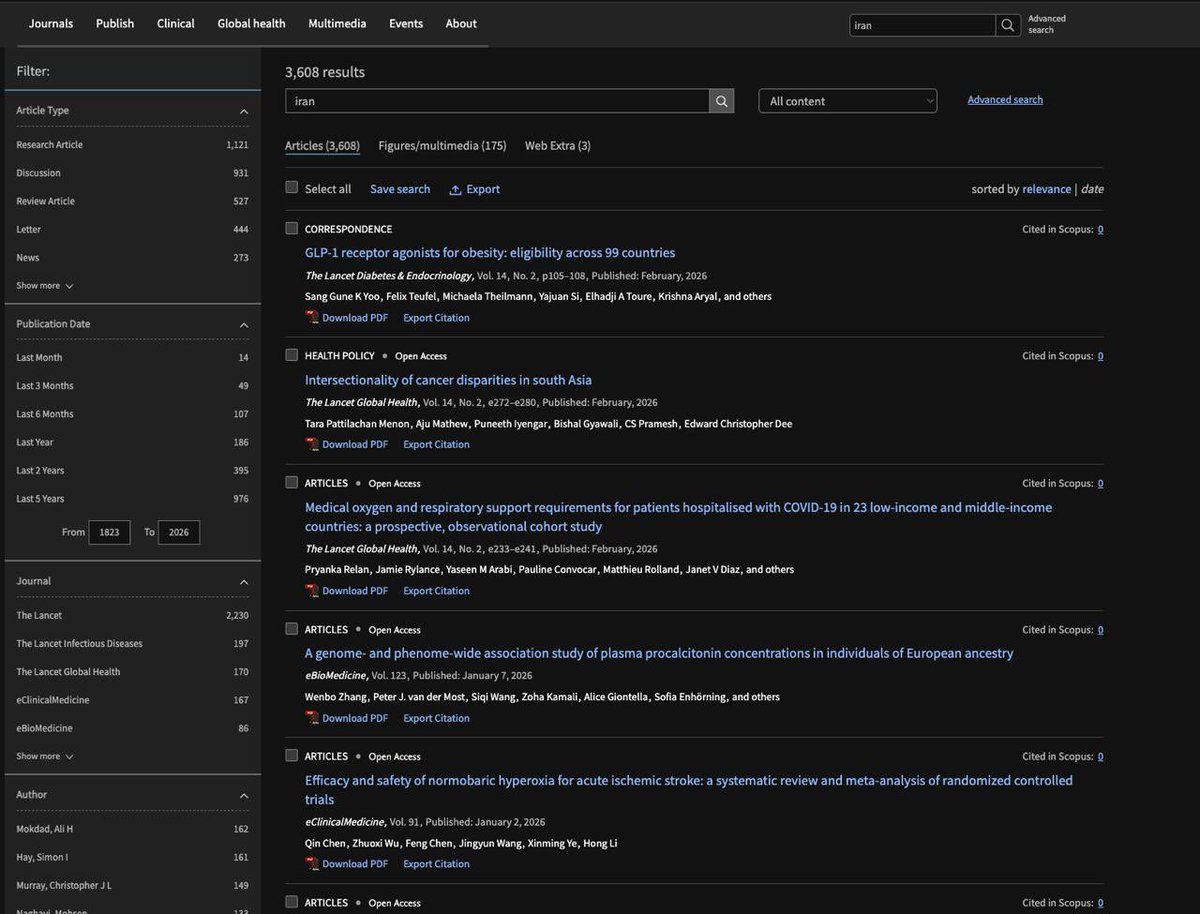
It's been more than two weeks since the start of the protests in Iran and more than 3 days since complete internet blockout. Reports confirm murdering of thousands of Iranians which is a public health crisis, yet the mainstream medical journals are in complete silence. In comparison to Gaza which has been the main topic of @TheLancet for a long time (1,027 articles to date, with the EiC as the main contributor with 40 articles), there is no single article on Iran's situation as of this moment.
Two years ago, I shared a post on my blog about this bias among top medical journals indicating some lives are more equal than the others.
https://t.co/Tr7cxADnA7