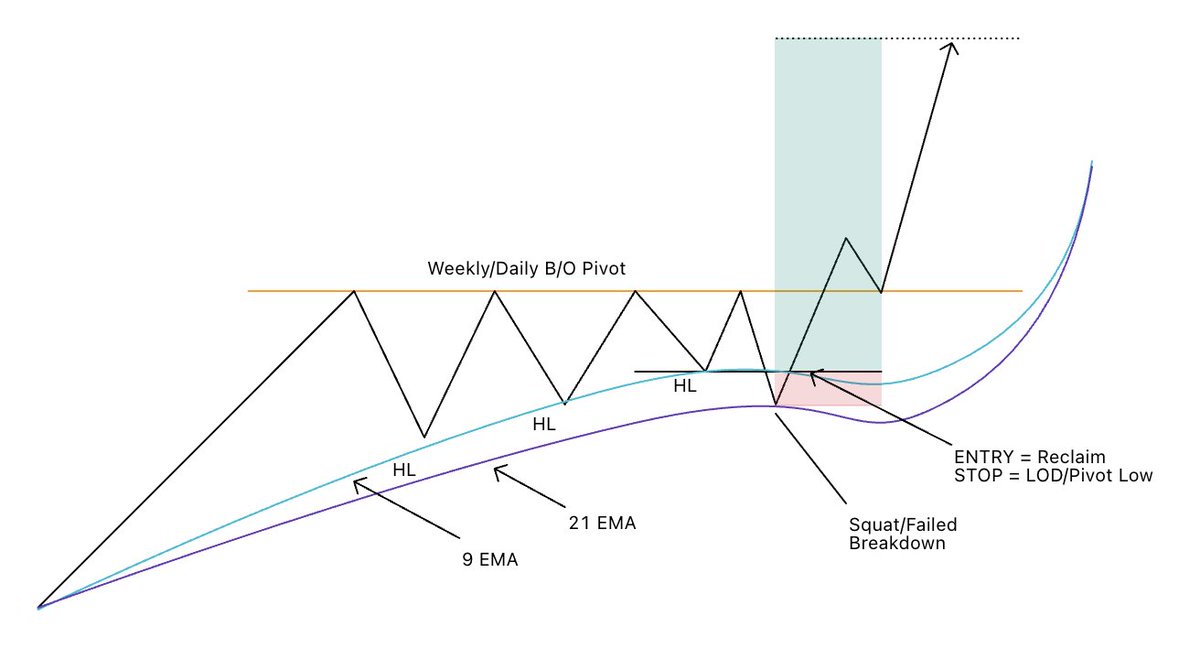
Since the start of the year, 90% of my entries have come from Undercut + Reclaim or (U&R) setups against key EMAs and weekly pivots, and this past week offered a few perfect examples of why this approach is so powerful.
Here’s why U&R setups are so effective in this environment:
Take $RKLB and $APLD, I caught over +100% on 20 Feb contracts in both names. The ideas came from defined risk entries at failed breakdowns, precisely at the points where buyers stepped in after testing support.
Failed Breakdown = Inflection Point.
When a stock undercuts a key level like the 9/21 EMA or a weekly pivot, it triggers weak hands to sell and shorts to feel "confident."
...but if buyers step in immediately, it creates a shift in control, turning a previous low into a "high probability" entry point.
1) Defined Risk (most important):
Your stop is clear, the low of the day (LOD).
If the setup fails, you’re out quickly, keeping losses small.
If it works, the upside is often asymmetric, as you’re positioned ahead of the next leg.
2) Psychology:
U&R setups take advantage of human behavior.
Sellers panic, shorts get trapped, and buyers who understand the structure accumulate at the low, forcing shorts to cover, fueling a leg higher.
The result is compressed volatility followed by expansion, giving a clean, high probability entry.
3) Alignment with Institutions:
By watching RS names and key pivots, you’re essentially tracking where the real money is accumulating.
When the stock reclaims the level, you’re entering in sync with supply/demand, not guessing at breakouts.
4) Simplicity + Repeatability:
Watch the low, wait for the reclaim, enter, risk at LOD.
That’s it.
No chasing, no overcomplicating.
It’s repeatable, definable, and scalable, exactly why it’s been my go to entry since the start of 2026.
Other examples from the past week:
$ASTS
$HUT
$IREN
$RKLB
$APLD
Every single one followed the same U&R logic:
undercut
reclaim
demand showing
tight stop
...and then let momentum do the work.
The market environment this year has been rewarding buyers who enter at these lows, while chasing breakouts has been brutal.
U&R setups give you defined risk, a clear structure, and the ability to stay ahead of momentum before it fully expresses itself.
If you want to trade with asymmetric opportunities in this market, learning to spot and execute U&R setups is a must!
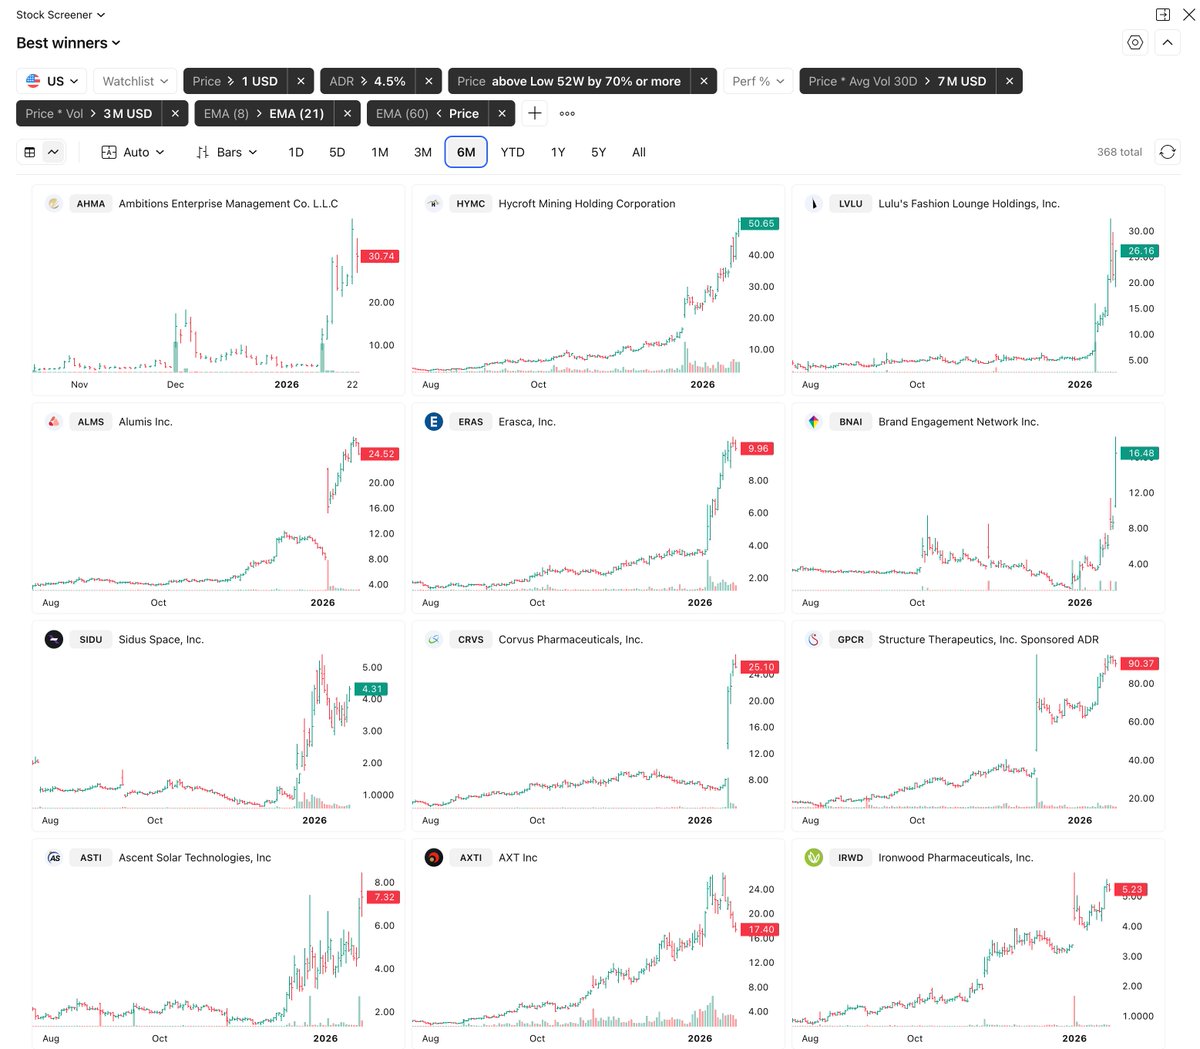
This is the BEST STOCK SCREENER I use to find real market leaders. 🚀💰
Use it now for FREE with @tradingview! (Link below)
Here is what I look for 👇
1) Exceptional Relative Strength
I focus on stocks already up 70%+ from their 52-week lows. Leaders move early. Late entries get punished.
2) Clean, Tight Structures
Flags, VCPs, compact bases. No messy price action. Strength shows through contraction, not chaos.
3) Clear Volume Accumulation
Multiple up-days on 1.5–2x average volume. That’s institutional buying leaving footprints.
4) Strong Fundamental Growth
EPS +50%, sales +20% YoY. Serious growth attracts serious capital. Do some research about the stocks!
5) Active Market Themes
AI infrastructure, batteries, crypto miners, space, drones. Momentum needs a story institutions care about.
6) Asymmetric Risk vs. Reward
I only take setups with realistic +50–100% upside and clearly defined risk. If the numbers don’t line up, I pass.
Here’s the TradingView screener:
🔗 https://t.co/nSy4nNasYR
I run this every day and every week.
Same process. Same rules. Repeatable results.
I’ve taught this exact approach to thousands of traders.
You can learn it too — structure beats everything.
تبي تربح بالأوبشن اقل شيء 2-3 الاف ريال باليوم؟
وممكن تربح أكثر طبعًا مثل ارباح بعض الاصدقاء الموضحة بالمقطع بعضهم يربح اكثر من 6 الاف ريال باليوم..
تبي تربح مثلهم؟
اقرأ هنا👇🏻
كلام مهم
لكُل من يتداول بالاسواق المالية..
بعطيكم سر أول وثاني...
لمعرفة اقتراب الانفجار السعري لأجل تدخل بدري وتاخذ الموجة كامله
خ��وصًا متداولين الأوبشن بتطلعون ذهب
وبشرط واحد مجاني😁
"لايك+ريتويت.."
لأجل يستفيد غيرك ولك الأجر
وبشرح لكم كل الاسرار اللي كنت اعتمد اطرح عليها سابقًا ونتائج الطرح موجوده بسلسلة الاقتباسات ادناه..
وبجهز الشرح وبنشره لكم صباح اليوم ان شاء الله
#الاستراتيجية_الذهبية
#US500
#SPX
الكتاب الثاني أيضًا مجاني ولكن ليس هذا الأهم ، الأهم والمهم هو أنّ يجب تمارس وتتدرب بحيث تظهر نتيجة تفرح فيها وتبعدك عن (أنا فيني زهايمر) حطيت جميع الأساليب والتقنيات لتحسين الذاكرة خذ واحدة كافية وأسحقها بالتدريب والممارسة :
•اختيار الكلمات.
•اختبار تسلسل الأرقام.
•اختبار الأشكال.
•اختبار الأرقام الثنائية.
•التصور والمراقبة (الرؤية).
•تمرين التصور من خلال الملاحظ.
•كيف تتذكر الاسماء والوجوه
https://t.co/DLLLVXiqe1
Relative Strength Table - Update
https://t.co/uW2sorplLH
This update includes three main additions:
1. Table Orientation Toggle
The layout can now be switched between “Vertical” and “Horizontal” from the settings.
2. Decimal Display Toggle
ON: Displays values to two decimal places (e.g., 85.23%)
OFF: Rounds values to whole numbers only (e.g., 85%)
3. Additional Table Positions
In addition to the standard left/right/top/bottom options, the following positions have been added:
“Center Top”, “Center Center”, and “Center Bottom.”
Many thanks to all who commented🤝
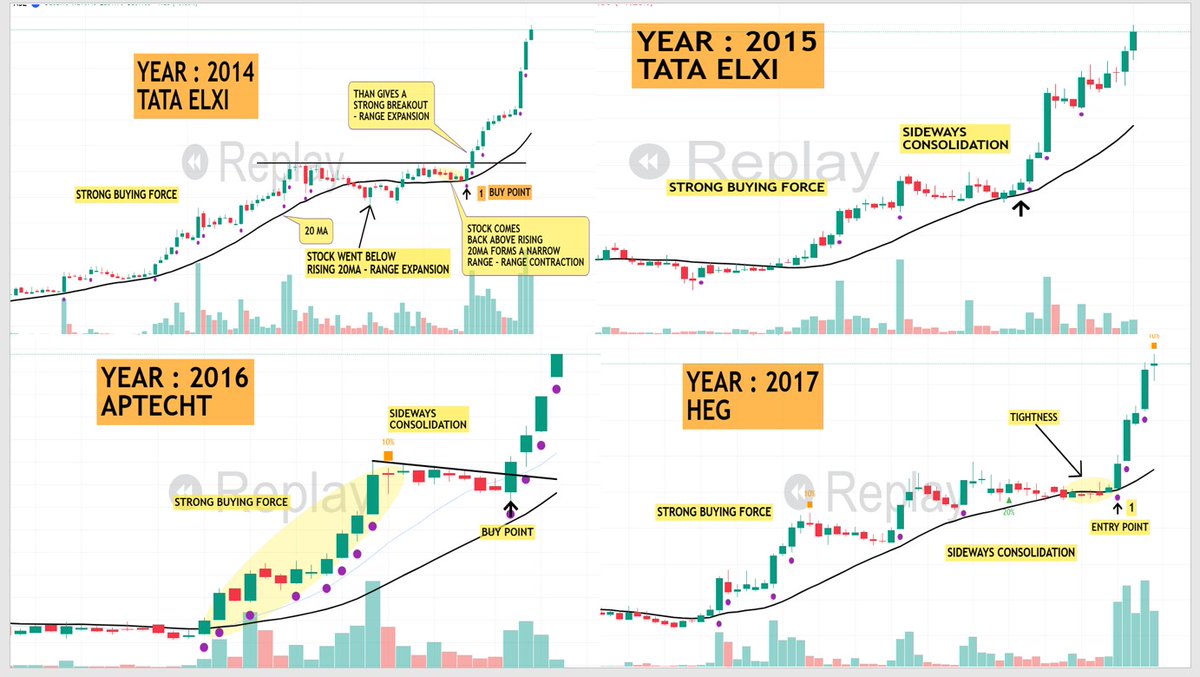
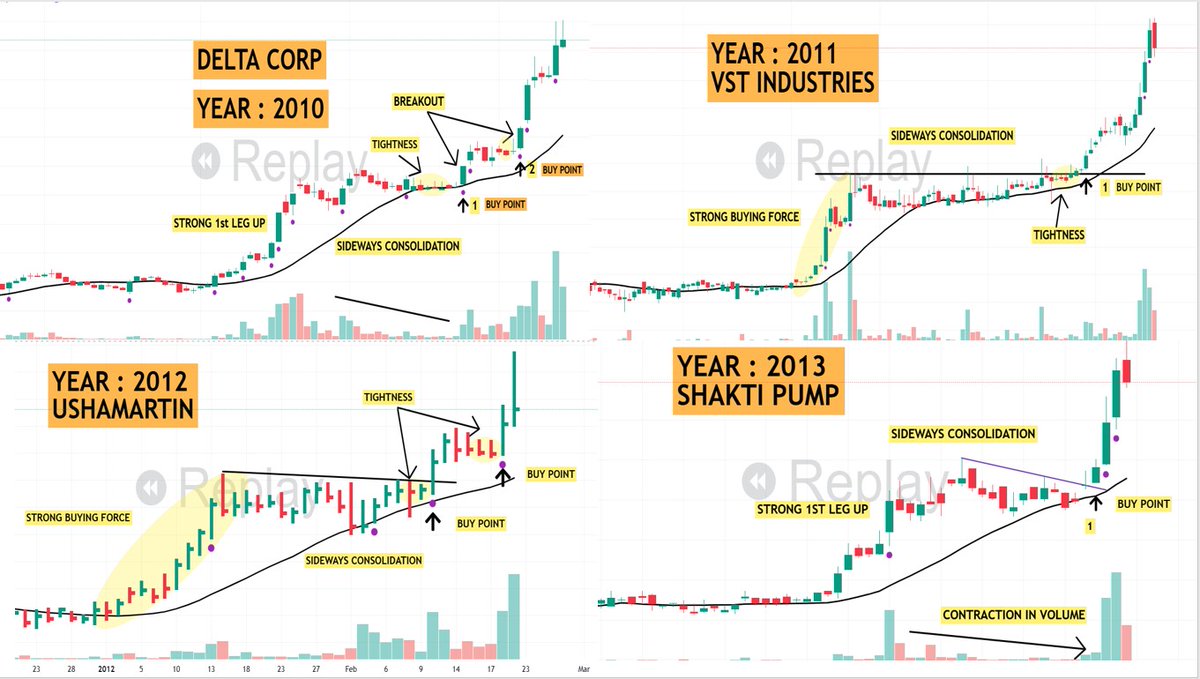
🔴Here is one more Reminder "Trading is all about Pattern Recognition" & Pattern repeats itself year after year.
🟧Have compiled same chart pattern from 2010 to 2024 to show :-
Charts change.
Market mood changes.
Market changes
But one thing doesn’t change :- Patterns repeat itself
Those who understand this will eventually do well in trading
Like , Repost
Follow @pheonix_trader for more such educational content.
#Brotip
كورس Machine Learning ل Andrew Ng هو اول خطوة لدخول الذكاء الاطناعي.
لكنه طويل وصعب، عشان كذا مافيه كثيرين يخلصوه، يفضلوا المقاطع الصغيرة والدورات السريعة.
@Aihmed_ml الله يوفقك
و��ستمر
Characteristics of Rocket Bases
1. one way very strong move . Higher the % of move stronger the move
2. Move is stronger if it has moved wrt to shorter time frame
3.Depth of the rocket base should ne shallow.
4. Rocket base should have perfect VCP
Follow @pheonix_trader
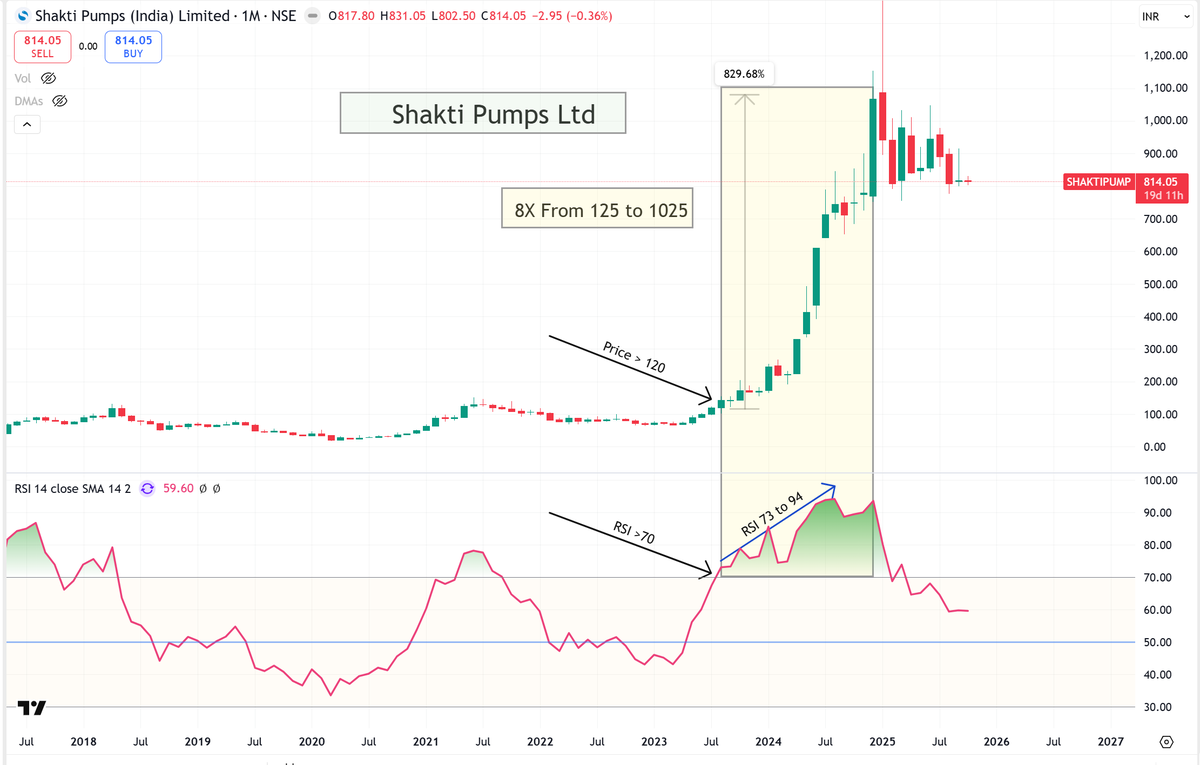
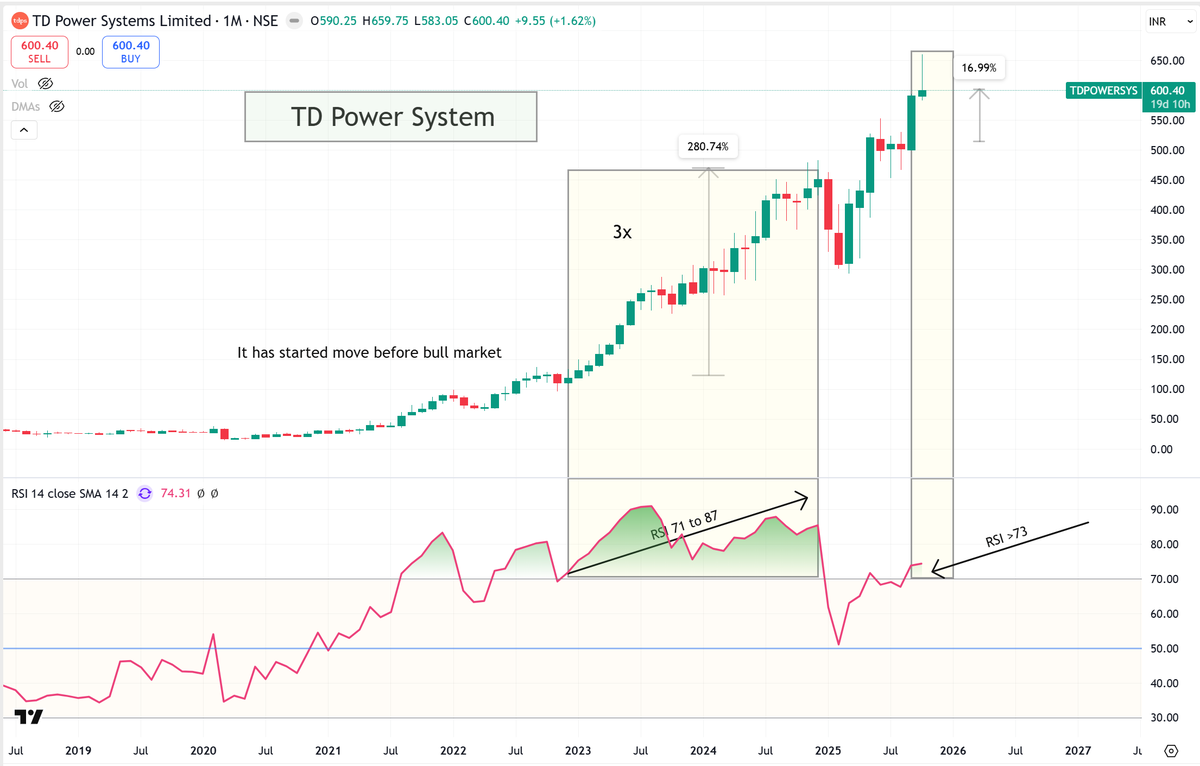
**𝐅𝐢𝐧𝐝 𝐌𝐮𝐥𝐭𝐢𝐛𝐚𝐠𝐠𝐞𝐫𝐬 𝐰𝐢𝐭𝐡 𝐌𝐨𝐧𝐭𝐡𝐥𝐲 𝐑𝐒𝐈 𝐬𝐭𝐫𝐚𝐭𝐞𝐠𝐲 **
How do you identify and hold stocks during a bull market to build multibaggers in your portfolio?
What gives you the confidence to stay invested in a stock? Let’s explore this using the monthly RSI.
I have backtested data from the previous bull market and found a common pattern among all the multibagger stocks. The investors who held these stocks in their portfolios noticed that they turned into multibaggers when a specific condition was met.
It’s actually quite simple — when the monthly RSI stays above 70, it clearly indicates a strong uptrend and shows the stock’s potential to become a multibagger.
I have tested this pattern across multiple stocks and observed the same consistent results. Now, let’s look at some examples below where you’ll notice this same pattern. You can even backtest it yourself — you’ll likely find similar situations.
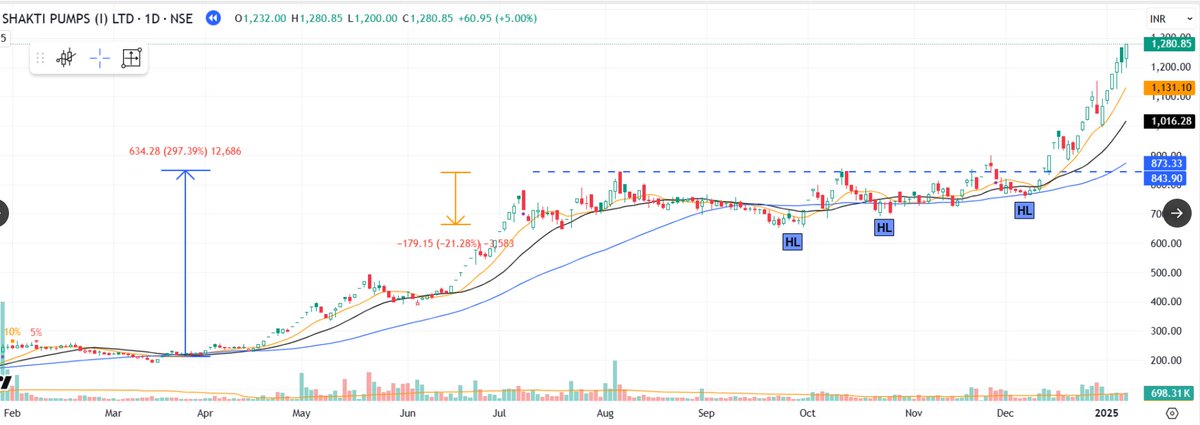
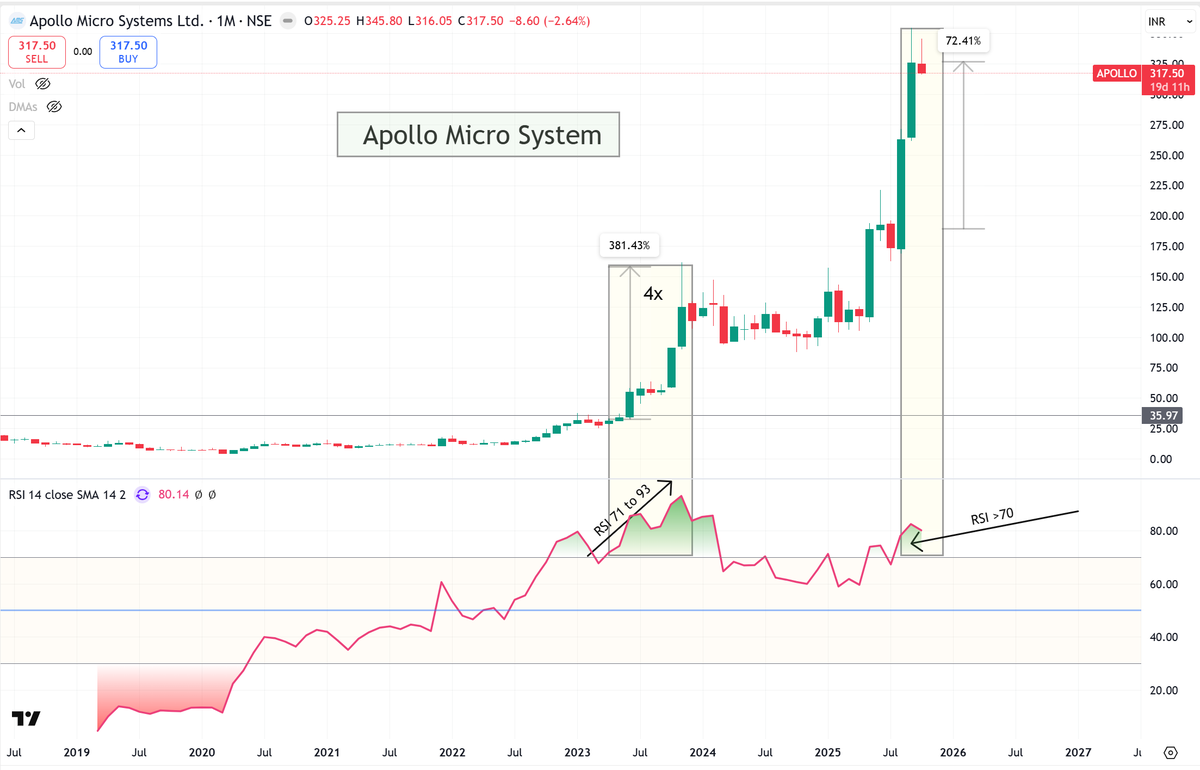
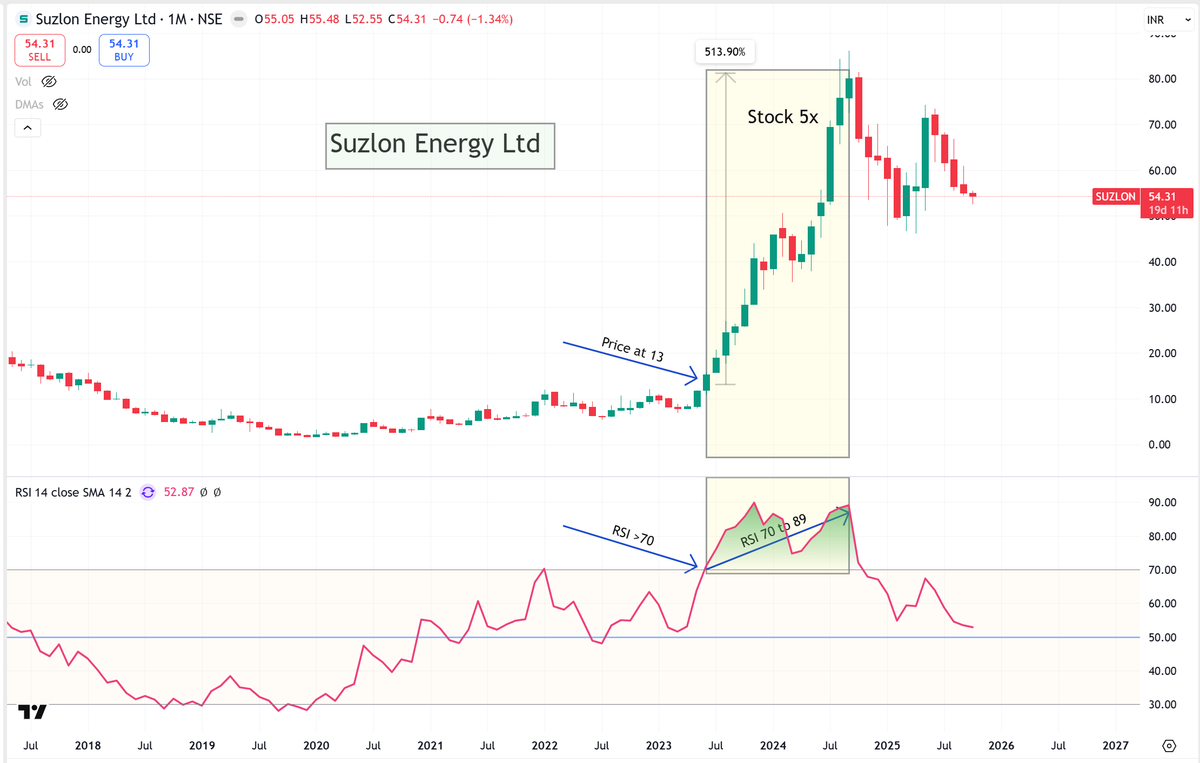
In my backtests, I’ve observed that when the monthly RSI rises from 70 to around 85, the stock price often doubles within a few candles. When the RSI further climbs to 93–94, the stock typically becomes a 4x to 7x multibagger. Of course, this move takes a few months, but with careful observation of chart patterns and sector strength, you can gain the confidence to stay invested and capture the full potential of the rally.
These patterns work effectively during a bull market. Now, the question is — how do you identify a bull market?
It’s actually quite simple. If the percentage of stocks trading below their 40W / 200 DMA moving average is less than 30%, it usually indicates that you are in a bull market.
Once you confirm that, the next step is to find the right sector leading the rally ( Ex: Power Sector ), and within that sector, identify the right stocks. When a stock’s monthly RSI crosses above 70, you’ll often see live examples of strong momentum and potential multibaggers forming right in front of you.
This insight can help you prepare for the next bull market and identify which stocks to hold in your portfolio for potential multibagger returns.
One important point to remember — this method is only for riding the stock, not for deciding your exit. For exits, you should always follow a separate strategy that suits your trading or investment plan
Shakti Pumps and Suzlon were part of my backtested examples, while Apollo and TD Power are currently showing similar setups — with their monthly RSI > 70.
One important point — you can set an alert in TradingView for when the monthly RSI crosses 70. Once it happens, TradingView will notify you automatically, making it easier to track potential breakout stocks in real time.
Mark Minervini Setup
How to find stocks
Screen stocks that are within 25% of their 52-week high
Eliminate the following stocks
Eliminate stocks trading below 30
200 MA is rising for at least 3 months
50 MA is above 200 MA
Current price is above 200 SMA and preferably above 50 too
Current price is at least above 100% from 52-week low
The stock should have made a 52-week high at least once every 4 to 6 months
Buying Pattern
Make stock list every week after weekly closing
Use weekly charts
Use Volatility Contraction Pattern (VCP)
Use only Price and Volume
Stocks moving up with good volume and then falling with lower volume (consolidating) is good
Use weekly charts
AMO daily charts are good for seeing setting of the stock
Look for volatility contraction in daily charts (just for looking entry)
You don’t need to find new candidates every day, try to add to existing position
Breakouts should happen between 4–8 weeks
Win rate is only 50%, so be prepared
Post Buying Monitoring
Follow up buying
Green days vs Red days
Up Volume vs Down Volume
Tennis Ball Action
Shallow Pullback
VCP Pattern
Volatility Contraction Pattern (VCP)
To calculate volatility contraction, divide swing low by swing high then -1 gives the % drop in volatility
There should be ideally 3 VCP
Each time volatility should decrease by ideally 50% (not a hard rule)
Buy when the previous swing high is taken out
With volatility, there is also time contraction which is very similar to price contraction
Take a stock for 2 VCP only if the second contraction is more than 70%
Stop Loss Calculation
Plot 20-period ATR on daily chart
Calculate 2× of the above value
Use this value as your stop loss
Use maximum of 10% as stop loss
Here’s Mark Minervini coming into the ‘95 uptrend based on what stocks met his criteria. He didn’t get really aggressive until April ‘95 - had an incredible 413% return that year! From ‘Trade Like A Stock Market Wizard’ - Minervini 2013
جرب الكتابة يومياً لمدة شهر.. لا توقف.
ممكن تستخدم ملاحظات الجوال، الايباد، جي بي تي، ورقة وقلم.. ما يفرق، أهم شيء تكتب.
الكتابة ممكن تكون خمسة دقايق، ربع ساعة، أو ٩٠ دقيقة. ما يفرق.. أهم شيء تستمر.
تكتب لنفسك، لغيرك، تمسح كل شيء تكتبه بعد الانتهاء من الكتابة؟ ما يفرق.. أهم شيء تكتب.
ممكن كتابتك تكون عن مقالة قرأتها، محادثة جميلة مع صديق، ممكن عن امتنانك لشيء عظيم "الصحة"، أو شيء بسيط "رائحة القهوة في بداية يومك"، ممكن عن ايميل هام، مشروع، كتاب، فكرة، لقطة من فيلم أعجبك الحوار فيها.. ما يهم هو الكتابة..
بعد فترة تصبح عملية الكتابة اليومية شيء ثابت في يومك وحياتك المُتغيرة باستمرار، وممكن تكون فيها بذرة لأفكار مستقبلية. بكل اختصار الكتابة بتعمل نقلة نوعية لعملية التفكير والتعامل مع مشاعرك إلى مستوى أعلى.
العقل ليس وحدة تخزين، فرّغ كل مشاعرك وأفكارك على الورق وبتشوف وضوح في تفكيرك يجعل هذه العادة اليومية مهرب جميل.
أكتب ولا توقف.
THE PIVOTAL POINT
While we know that the pivot point acts as an entry level to catch stocks before they breakout.
You should NEVER enter prior to a pivot being broken.
Here are recent examples of what happens if you assume price action and don't wait for the pivot to be broken or enter at a random price.
BANCOINDIA - down 10%
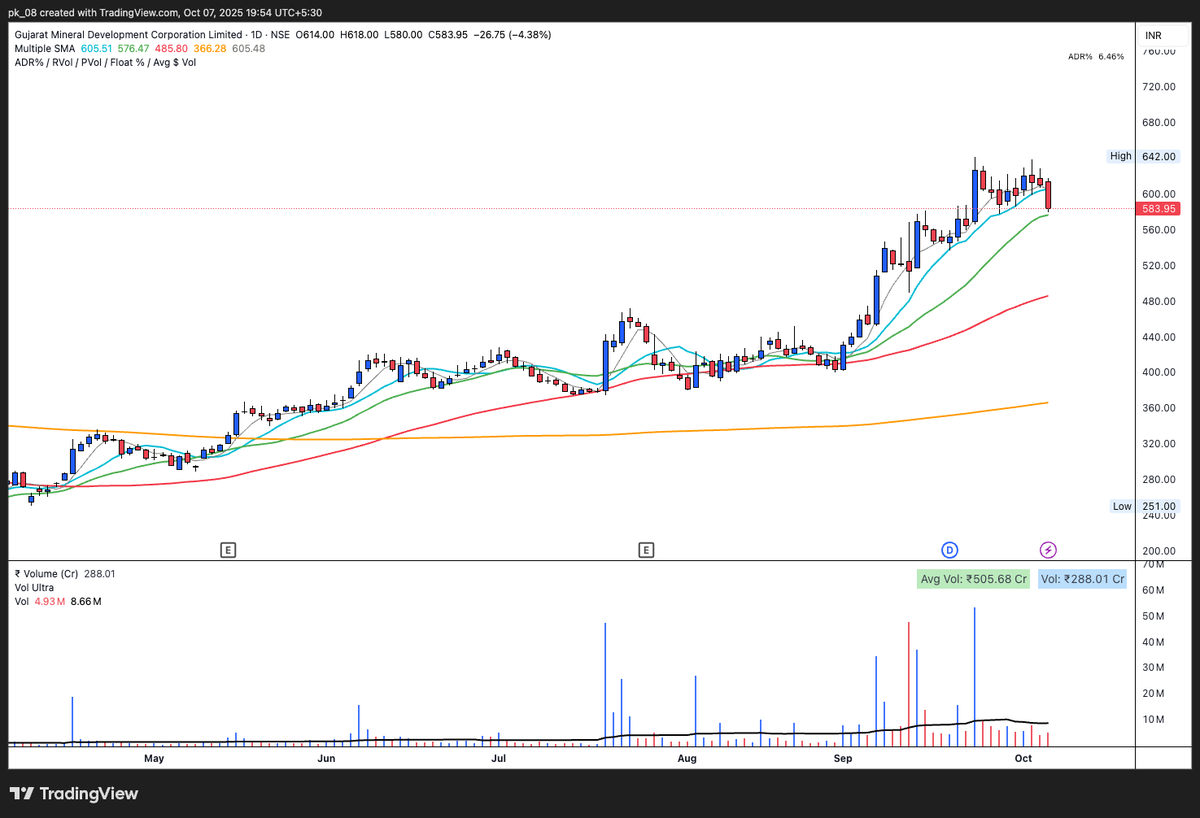
GMDCLTD - down 4%
CYBERTECH - down 25% from recent highs
TATAINVEST - down 20% from recent highs
Key takeaway
When we have rules in place, we must follow them. Breaking rules and trying to catch the move ahead of time, often leads to bigger drawdowns and irrecoverable losses.
Wait for the pivot to be broken and trade well!
BANCOINDIA - The wedge trap
A wedge up often looks strong on the charts with higher highs, higher lows and a steady climb. But underneath, momentum is fading and supply starts to build up quietly.
Here’s what usually happens:
- Each leg up gets weaker.
- Volumes dry up as the stock moves higher.
- The breakout attempt struggles, and when it fails, the fall is sharp as it happened with Banco today.
Layman explanation:
- In a wedge up, buyers keep pushing the stock higher but with less strength each time. Early buyers start booking profits, and new buyers enter late, hoping for another breakout.
- Sellers slowly become more active as they see the momentum fading. Buyers lose confidence, and once the stock fails to make a strong move, panic selling picks up sharply, leading to a quick fall.
- It’s basically a phase where enthusiasm fades and profit taking/panic selling begins to dominate.
Takeaway:
It is always better to avoid wedge up bases and prioritize sideways and pullback bases (refer the quoted post below)
I buy all at once because I wanted to be sized right IF I am right.
But I scale out of my positions in stages. That really helps me capture the short, medium and longer trends, keep my mind calm.
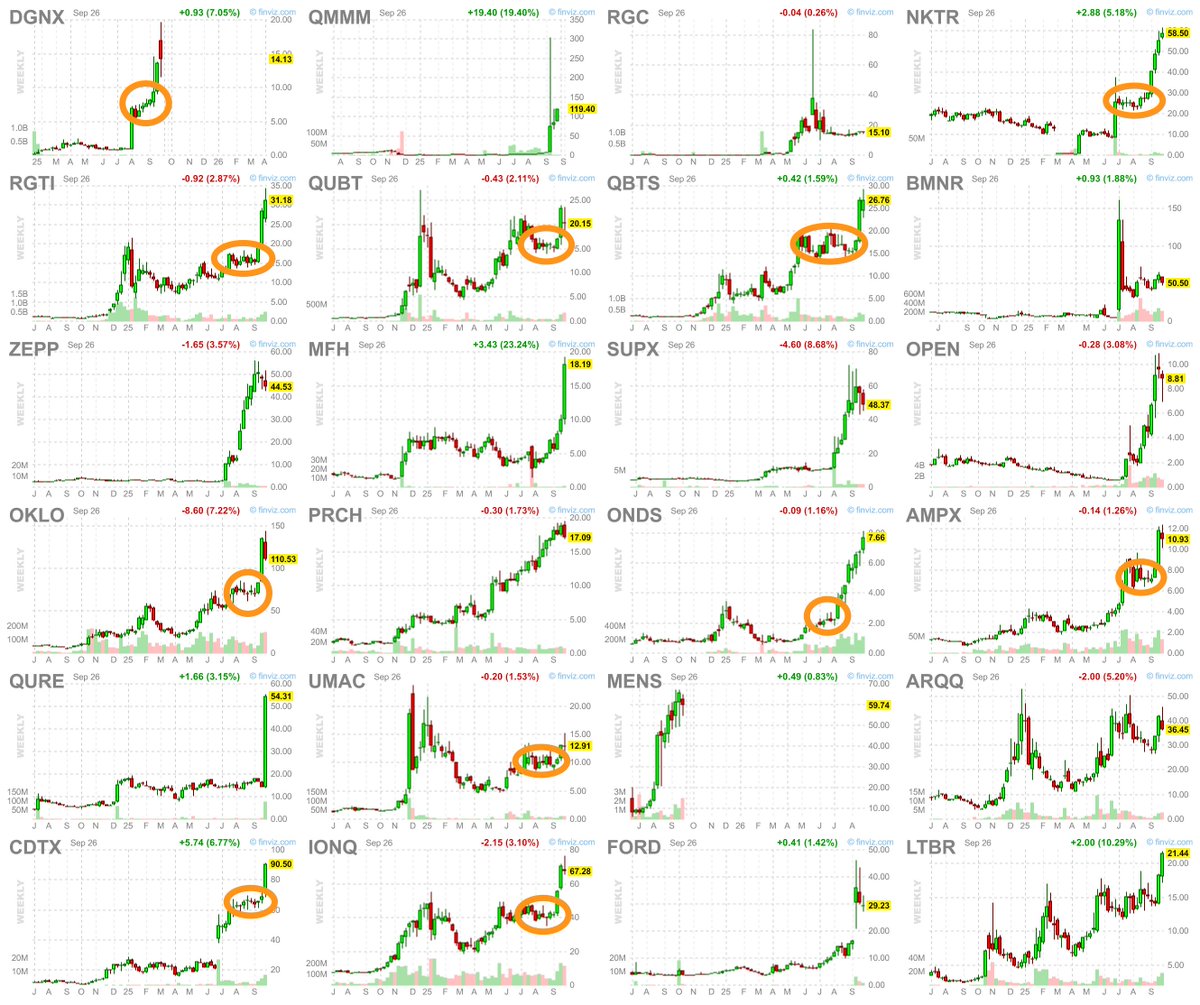
Looking for the strongest stocks in the market? 🚀📈
You don’t need paid tools — a free FinViz screener is enough.
Here’s how I use it 👇
1. Relative Strength: I want leaders up +50%+, not laggards.
2. Chart Patterns: Volatility contractions! Flags, VCPs, tight consolidations only.
3. Volume: Big up-days on 2x average volume = funds buying.
4. Growth: EPS +50%, sales +20% YoY attract institutions.
5. Themes: AI, batteries, rare earths, biotech, drones.
6. Reward vs. Risk: Must offer asymmetric payoff, 5–10:1.
📎 Free Screener Link: https://t.co/0C8u4RhBRZ
I scan it weekly. I’ve taught this process to thousands.
You can learn it too — structure beats randomness every time.
اغلب من يعمل في مجال الذكاء الاصطناعي مر بتحدي الموارد والتكلفة العالية لتدريب النماذج، خصوصا عند الوصول لمرحلة fine-tuning أو استخدام التعلم المعزز (RL)
الطرق التقليدية الحالية لتدريب نماذج الذكاء الاصطناعي الكبيرة تعتمد على سيرفرات GPUs ضخمة ومتزامنة، بتكلفة هائلة وبنية تحتية معقدة متوفرة للجهات الكبيرة فقط، مما يجعل تدريب النماذج اللغوية المتقدمة موضوع شبه مستحيل للطلاب أو للباحثين أو الشركات الصغيرة والمتوسطة.
فإن أكثر ورقة بحثية انتشارا حاليا في المجال تطرقت إلى هذا التحدي بابتكار جديد يركز على التدريب اللامركزي:
Sharing is Caring: Efficient LM Post‑Training with Collective RL Experience Sharing
البحث يقترح طريقة تدريب جديدة باسم SAPO:
(Swarm sAmpling Policy Optimization)
الطريقة لامركزية وغير متزامنة بالكامل، تتيح لأي جهة او شخص حتى بموارد بسيطة تدريب نماذج قوية دون الحاجة إلى supercomputers
وتقوم فكرتها على تدريب جماعي للنموذج موزع بين آلاف الأجهزة غير المتزامنة، ب��يث ان فوائدها:
- تدريب لامركزي بالكامل دون الحاجة لتزامن بين الأجهزة
- مرونة في المشاركة تسمح للأجهزة بالانضمام والمغادرة في أي وقت خلال التدريب
- توافق واسع يشمل أجهزة الألعاب مثل RTX 3090 وRTX 4090 وحتى السيرفرات المتوسطة
- نقل ذكي للمعرفة حيث إذا اكتشف أحد الأجهزة إجابة جيدة، تتم مشاركتها تلقائيًا مع الشبكة (النموذج)
- خفض كبير في التكاليف مقارنة بالطرق التقليدية المعتمدة على سيرفرات ضخمة وتمكن الباحثين والشركات الصغيرة من تدريب نماذج متقدمة دون الحاجة لبنية تحتية ضخمة
هذا الابتكار قد يترك أثرا حقيقيا على مستقبل الذكاء الاصطناعي، خصوصا في جعل التدريب ��لمتقدم متاحا للكل وليس فقط الشركات العملاقة.
هناك الكثير من التفاصيل التقنية الدقيقة في الورقة لم أذكرها هنا بشكل مفصل او دقيق وحاولت اسردها بشكل عام ومصور.
أنصح بقراءتها بالكامل لكل مهتم بالتدريب، التعلم المعزز، أو النماذج اللغوية.
📄 الورقة:
https://t.co/mtPQHeO5p8
💻 الكود مفتوح المصدر:
https://t.co/GbzsFHt7Xy
لأنكم تستاهلون كل خير ☝️
وكلنا نحتاجها هالفترة
#دورة_مجانية مصغرة يوم واحد
( إستراتيجية دخول المستثمر )
حسب طريقة: #لاري_ويليامز
السعر: دعوه في ظهر الغيب
التسجيل لأول 500 شخص 👇
ودي ناخذ عدد أكبر ( البرامج محدودة )
تم+رتويت
لعل أحد يستفيد
https://t.co/yAg7LJhkkU
#تاسي
✈️
بتسافر قريب هذي من اشهر برامج الشرائح الالكترونية eSIM 🔸⤵️
أيرالو خصم 3$ عند التسجيل
https://t.co/23BEqGsilC
هوفلاي خصم 5$ عند التسجيل (في #تركيا تحديدا جربتها كلها هوفلاي افضل)
https://t.co/mXCtF3qEpf