Top #Coffee Producing Countries
Million 60Kg bags, 2020
☕️
63.4 🇧🇷
29.0 🇻🇳
14.3 🇨🇴
12.0 🇮🇩
7.3 🇪🇹
--
Top 5 = 75% of the World's total coffee production
(@VisualCap)
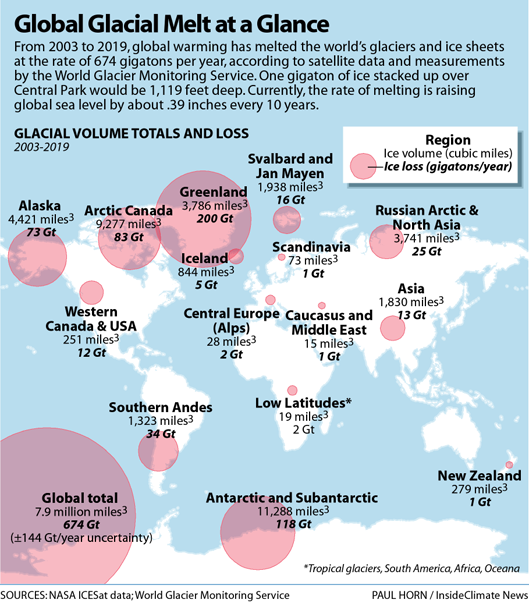
Global glacial melt 🗻 per region
#Ice loss (Gigatons/year) 🧊
674 Global total
Top 5:
200 Greenland
156 Arctic Canada & Alaska
118 Antarctic
34 Southern Andes
25 Russian Arctic & North Asia
#ClimateCrisis#SDG13
(@insideclimate)
#carbonneutral goals
137 countries committed
✅Bhutan & Suriname already carbon negative
2030-2045: Uruguay, Finland, Austria, Iceland, Germany, Sweden
2050: 124 countries
2060: China, Kazakhstan, Ukraine
2050-2100: Australia & Singapore
(@VisualCap)
#FoodLoss & #FoodWaste 🗑️
Globally:
14 % of food produced is lost between harvest & retail
17 % of total global food production is wasted
11 % in households 🏘️
5 % in the food service 🍽️
2 % percent in retail 🛒
#FLWDay | #SDGs#SDG12
(FAO)
Drylands 🏜️
3.8 billion people live in climate-vulnerable drylands
25% of the global population
50% of the world’s livestock
27%of the world’s forests (2019)
store 30%of the world’s soil organic carbon
supply ~60% of the world’s food production (2018)
@FAO | @IUCN
#ClimateChange & Displaced people
33.4 million newly displaced (2019)
▪️ 70% due to climate-related disasters 🌀🔆🌪️🌧️
(2008–2018) 23M people/year
▪️ 90% of which have had weather-related triggers 🌊🌬️🔥
#ClimateCrisis@CGIAR | @CGIARclimate | @FAOclimate | @CARE
#eWaste Generated Per Capita
(kg/capita, 2019)
21 North America🌎
16 Europe 🌍
16 Oceania🌏
9 Latin America & Caribbean 🌎
6 Asia🌏
3 Africa 🌍
#CircularEconomy
(@ChathamHouse)
Past Earth #Overshoot Dates
1970: December 29
1980: November 4
1990: October 11
2000: September 23
2010: August 7
2019: July 26
2020: August 22
2021: July 21
(@EndOvershoot)
Refrigerated Warehouses, Capacity
(million m³)
Worldwide:
719 in 2020*
_________
Top 3 countries :
156 🇺🇸
150 🇮🇳
131 🇨🇳
__________
*16.7% greater than the capacity reported in 2018.
(@gccaorg)