Analyzing technical and tactical data with PowerBi.
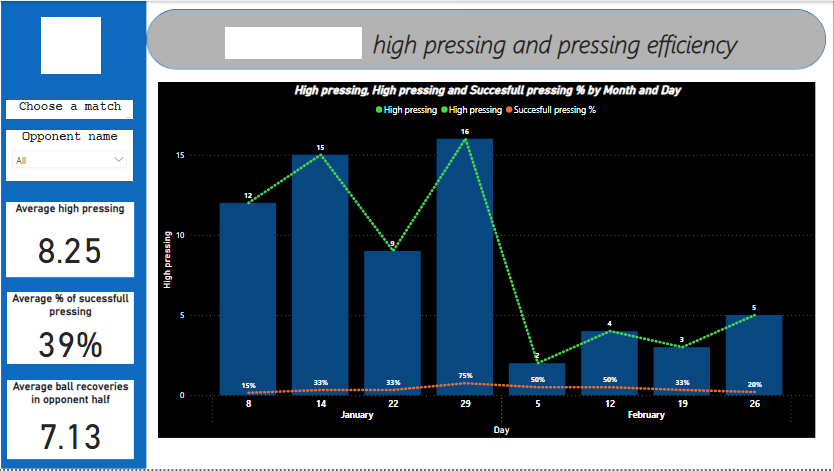
📉 In the picture we can see a big drop in "high pressing" and "pressing efficiency" numbers in the last 4 games, when compared to the last 8 games of this team.
#dataanalysis#tacticalanalysis#PowerBI
More in comments below:
How helpful will be this data for the manager when analyzing our next opponent?
Will this fact influence our approach in the next match?
Is this an important stat for our manager if this data is from our team?
Analyzing technical and tactical data with PowerBi.
📉 In the picture we can see a big drop in "high pressing" and "pressing efficiency" numbers in the last 4 games, when compared to the last 8 games of this team.
#dataanalysis#tacticalanalysis#PowerBI
More in comments below:
📽 Apart from video analysis of the games, which we normally present to our managers, I think it is very important to give him insights into how our opponent's stats are in the last games, comparing them to some other games.
@JoaquinReiris Hello, I am sorry but it is not possible because it is not a dashboard. The visualizations are created with PowerBI, a data visualization tool, but first, you need to have your database, and then visualize the tools. What you see is the visualization only.
Analyzing different exercises and comparing them to game scenarios for different player or team averages.
📊 Analyzing how the exercise differs from an average period of the game or worst cast scenario period with the same duration.#datascience#PowerBI#football#loadmonitoring
@wahv94 Hello, I am sorry but it is not possible because it is not a dashboard. The visualizations are created with PowerBI, a data visualization tool, but first, you need to have your database, and then visualize the tools. What you see is the visualization only.
@MinimumWidth I like the thing that the striker did not rushed to run into the space created and bring his mark there, instead he was patient and kept the defender away from the created space.
Monitoring of daily and weekly targets with PowerBi.
📊 Monitoring if the set weekly targets for the week are fulfilled.
🏃 Monitoring if the daily target for the chosen metric is completed depending on the type of day.
#powerbi#monitoring#football#DataAnalytics
In the video is an example of the Sprint Distance metric and Number of sprints above 25km/h.
Sprinting distance of 100m can be achieved with 2 efforts of 50m sprint, but we can see that in the match sometimes players need 5 sprints to achieve 100m, and 15+ to achieve >200m.
For example, High speed running and High Metabolic Load Efforts, it is different if you have 500m of HSR, but you have done it with 5 efforts, and with more efforts. We always want to work relative to what the players are working in the match.