Entrepreneur | Investor | Trader | Financier & Economist | My ideas & charts are designed to make you wiser. Tweets are not investment advice. Trust your plan.
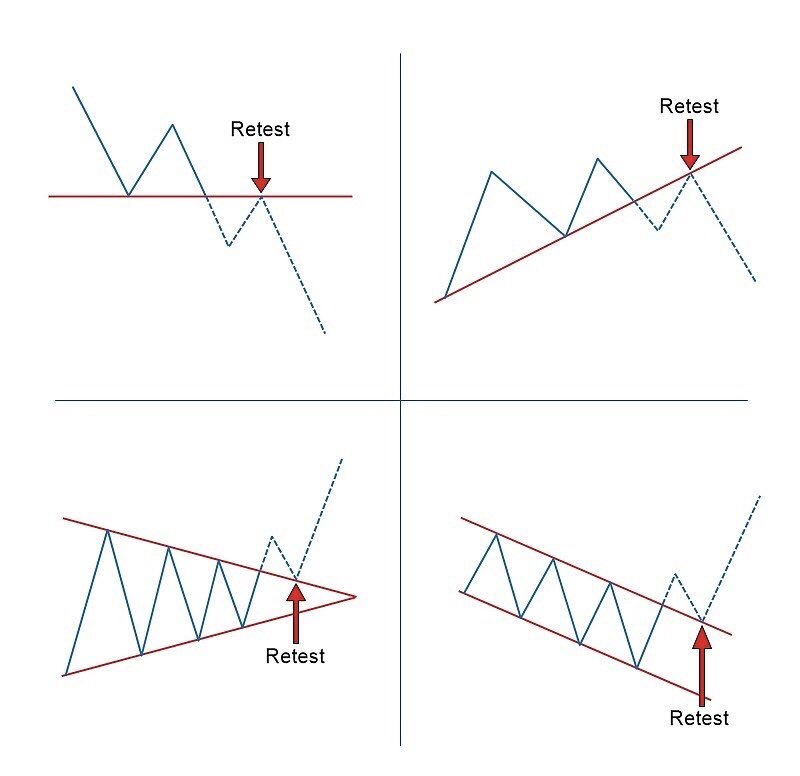
Always wait for the retest. They occur after a price breakout and it establishes resistance as the new support. If the retest holds, this is where you enter the trade for real gains! #trading#crypto#stocks#forex
Oh boy....
Now it's official....
Commodities just poked their head out of a 12-year resistance.
Major changes in the macro landscape likely ahead.
This is indeed inflationary.
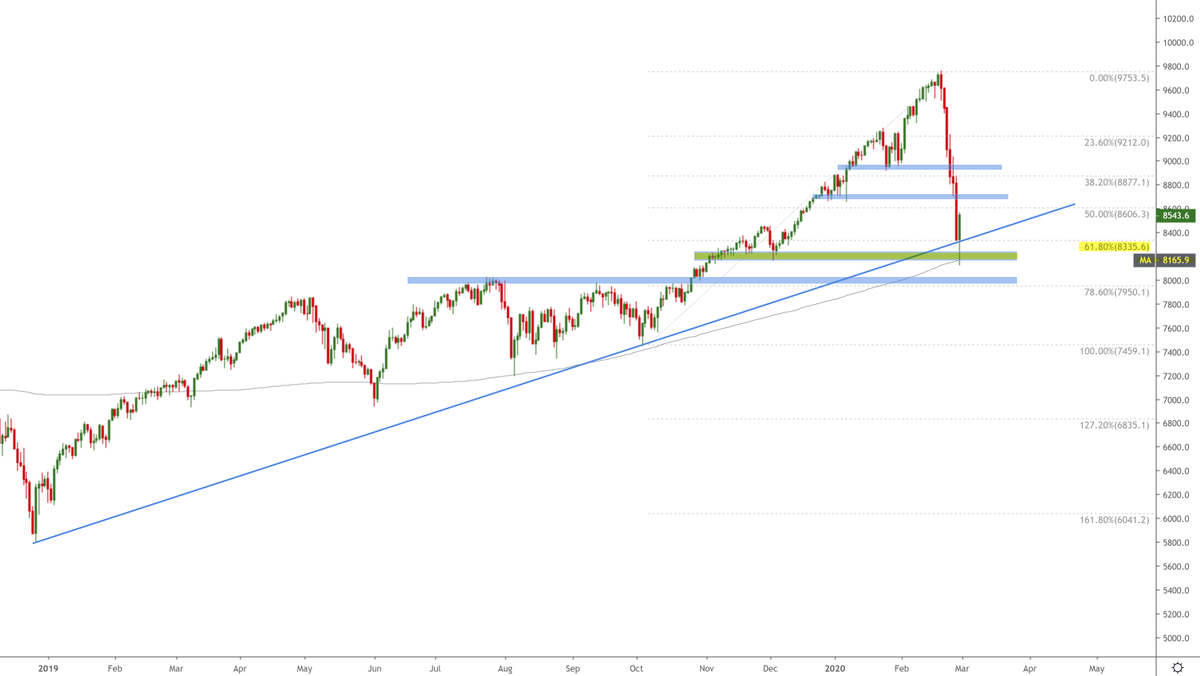
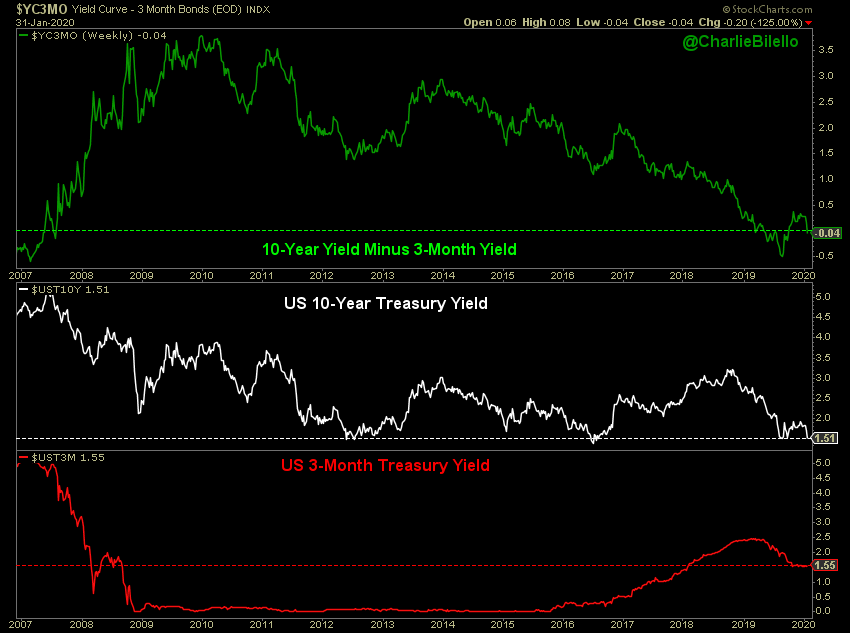
$NQ_F on Friday, it bounced off four key chart elements on daily chart:
1) horizontal support around 8200
2) SMA200 (grey)
3) 61.8% fib retracement from 03 Oct 2019
4) longterm ascending trendline from 26 Dec 2018
#bullish if holds above all. #nq_f $ndx $qqq
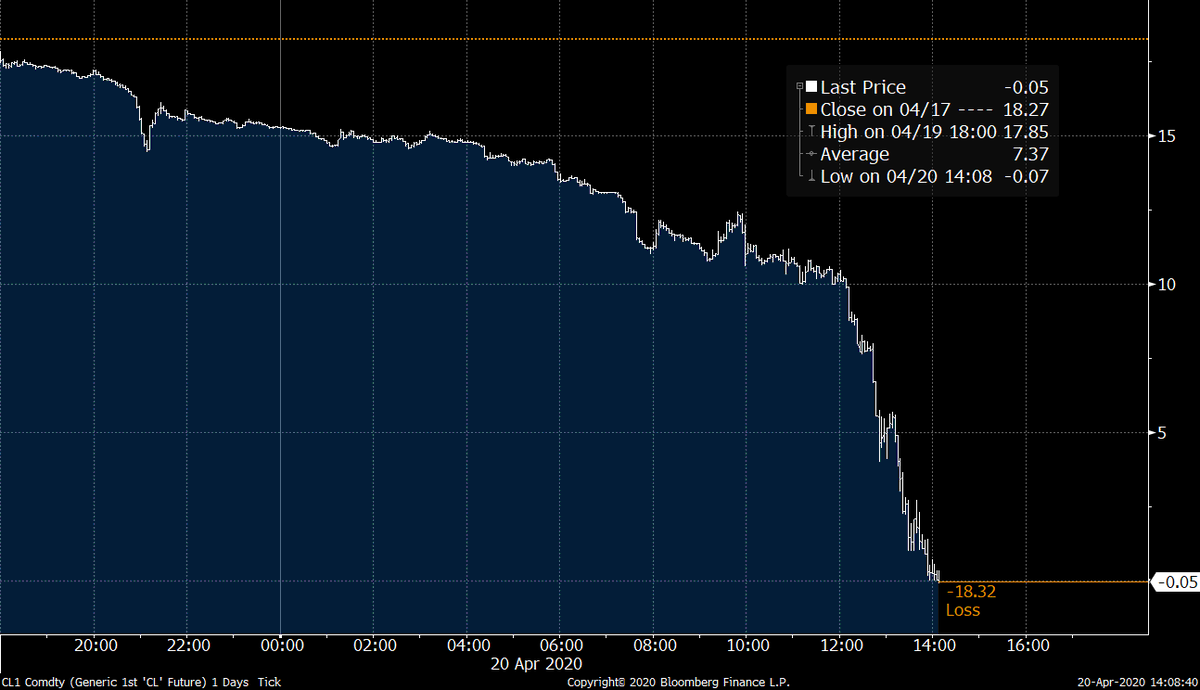
Buckle up.
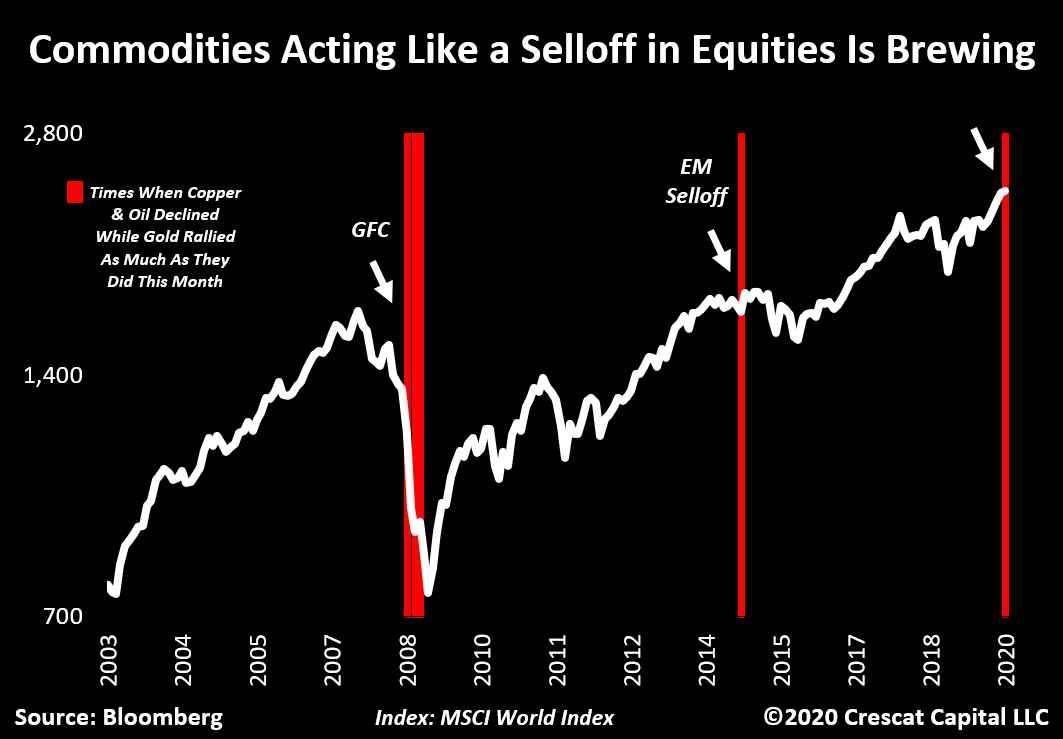
Oil & copper plunging while gold rallies?
This only happened a few other times in history:
During the Great Recession & just prior to the EM meltdown.
Commodities are clearly acting like a selloff in stocks is approaching.
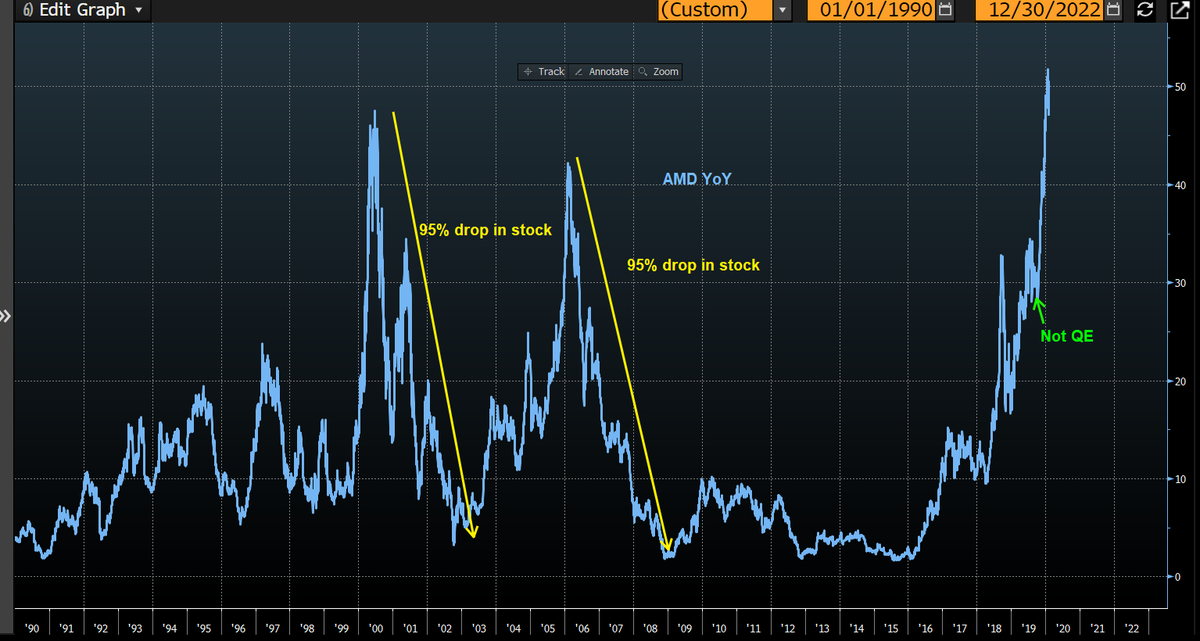
For everyone that thinks this stock market is just a big bubble look at in context of the last 80 years, this is what bull markets look like.
Chart by @bostonchaahhts
My absolute favorite chart going into 2020 ...
Trend Reversal Timing Tool has worked 7 out of 8 times since 1999. Heck of a timing tool! Can we go for 9?! 😉
#GAAP
$SPX
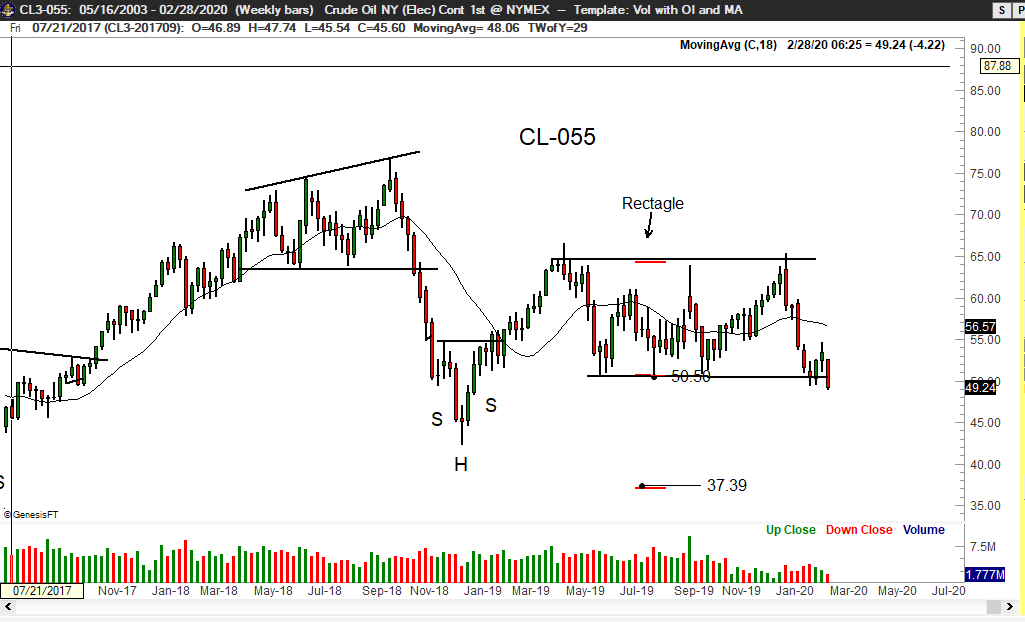
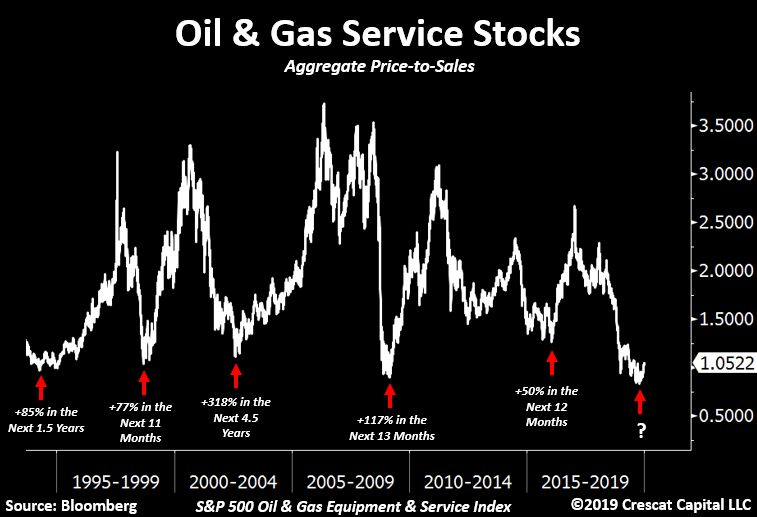
Energy service stocks never looked so cheap.
Price to sales ratio now below times that preceded major bottoms.
One of the few industries trading at 1x annual revenues.
Commodities are historically undervalued, plenty value to be found.