@Amper talked with @Dianavtodea about #AI coding assistants that are already emitting rich #OpenTelemetry data, revealing prompts, tool usage, workflows, and developer behavior in real time.
👉 Watch now: https://t.co/xbshkE2sKn
#Telemetry
Telemetry Talks episode 5 is here 🎙️
In this episode, @dianavtodea joins @Amper to explore vibe coding, #AI agents, and the growing need for #observability in #GenAI systems, from prompts and token usage to reasoning chains and distributed #traces
Using the VictoriaMetrics stack as the foundation for understanding the next generation of autonomous software.
If you're looking to better understand observability, #OpenTelemetry, and AI agents, this episode is for you.
👉 Watch now: https://t.co/nGAMbUPEdW
#TelemetryTalks
What’s the best #observability signal to start with?
In #Telemetry Talks episode 3, our engineer @Amper breaks down how choosing the right signal from the beginning can save time, reduce noise, and set you up for better observability from day one.
If you’re working with #metrics, #logs, or #traces, this is a great place to start.
Watch the short here on YouTube 👇
https://t.co/cKGFqphQNy
#OpenTelemetry #DevOps #Monitoring #TelemetryTalks
Telemetry Talks episode 3 is here 🎙️
In this episode, @DianavTodea joins @ReadTheDuck and @Amper to break down OpenTelemetry observability signals: #metrics, #logs, and #traces, and how #VictoriaMetrics handles each with high performance, cost efficiency, and seamless integration.
We cover:
✔️ What each signal actually means without overcomplicating it
✔️ Common misconceptions around #observability
✔️ Where to start if you're new to metrics, logs, and traces
Plus, we go hands-on:
→ Integrating VictoriaMetrics with the #OpenTelemetry demo
→ Exploring Grafana dashboards
→ Testing all three signals in dedicated playgrounds
If you're looking to better understand observability and make it work at scale, this episode is for you.
👉 Watch now: https://t.co/LaYvowkEkC
#TelemetryTalks #Metrics #Otel
If your vibe coding tools support OpenTelemetry, you’re 90% of the way to full observability. The missing 10% is in this guide.
@amper shows how to enable instrumentation in tools like Claude Code, #OpenAI Codex, Gemini CLI, #OpenCode, and #Qwen Code using #OpenTelemetry and the #VictoriaMetrics Stack.
Track token usage and costs, understand performance bottlenecks, debug issues more efficiently, and meet enterprise compliance requirements.
The result: full visibility into AI-assisted development.
By integrating #telemetry into VictoriaMetrics Stack, you can create insightful dashboards and queries that address key questions about your AI-assisted development processes, utilizing MetricsQL for metrics and #LogsQL for #logs and traces.
Learn more in our latest blog post 👇
https://t.co/z47katX5MV
@amper explores the new VictoriaMetrics #MCP Server. He moves beyond the hype to show what's truly possible today.
In his latest presentation at @OSODaycom, he offers a builder's perspective on integrating #AI with time-series data, featuring a demo that showcases both the potential and the current realities (yes, there are some). Discover how we're tackling complex #monitoring challenges with AI.
If you're curious about #observability and AI, this one's for you. 👇
https://t.co/3Z2Zfs1Mbg
#TimeSeries #DevOps
Start the week with a new VictoriaMetrics blog post on AI Agents Observability! ☕️
AI agents are gaining popularity and increasingly integrated into production environments. However, this fast adoption introduces new observability challenges that call for adaptable, flexible solutions.
In his latest blog post, Alexander Marshalov (@Amper) explores how to address these challenges by combining two powerful solutions:
🔹 OpenTelemetry abstracts away implementation details in your library, requiring just a few lines of configuration code.
🔹 VictoriaMetrics Stack (VictoriaMetrics + VictoriaLogs + VictoriaTraces) provides outstanding performance for observability.
“...High-quality observability for AI agents is no longer a moonshot project. Explore how you can quickly start collecting all signals from your AI agents using OpenTelemetry and the VictoriaMetrics Stack across popular frameworks and libraries…”
👉Read the full blog post: https://t.co/PSweyCkuSX
#VictoriaMetricsStack #AIagents #Monitoring #OpenTelemetry
@amper explores the new VictoriaMetrics #MCP Server. He moves beyond the hype to show what's truly possible today.
The presentation offers a builder's perspective on integrating #AI with time-series data, featuring a demo that showcases both the potential and the current realities (yes, there are some). See how we're thinking about solving complex #monitoring challenges with AI.
If you're curious about #observability and AI, this one's for you. 👇
https://t.co/ZKoPSBxQqi
#TimeSeries #DevOps
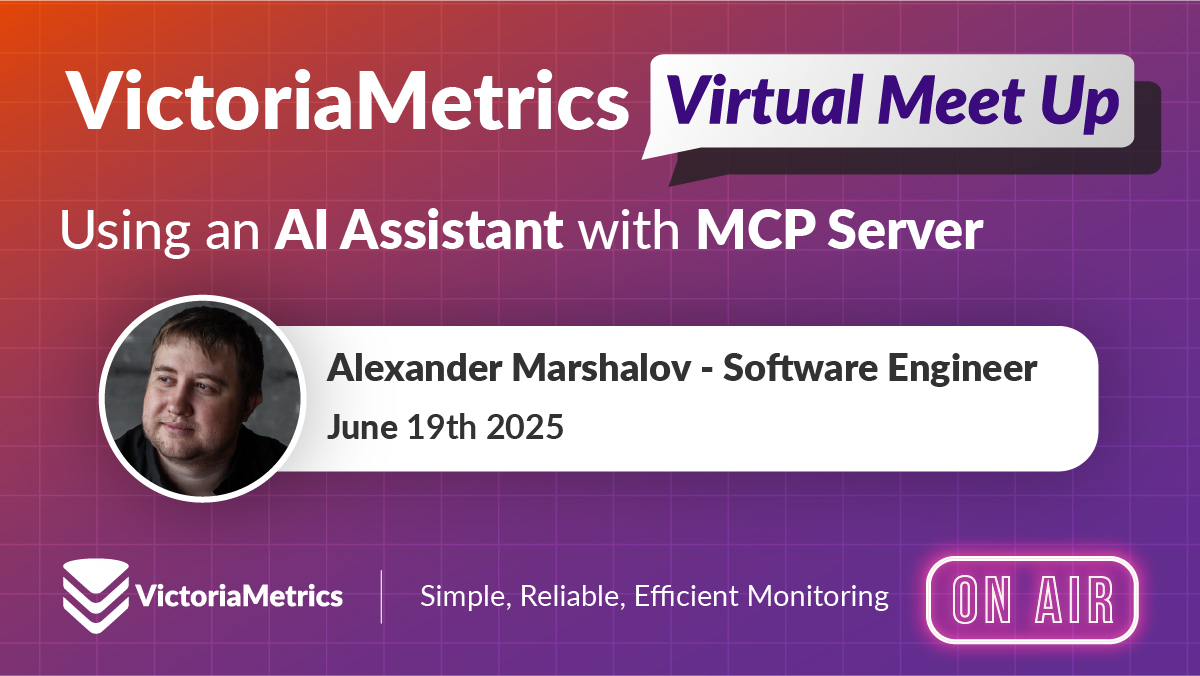
🚀 Get ready! Our second virtual meetup of 2025 is just one week away!
📅 June 19th – 5 PM GMT | 6PM CEST | 9 AM PST
🔍 Agenda highlights:
🟣 VictoriaMetrics Roadmap Update
🖥️ @amper will present a new #MCP Server for VictoriaMetrics
🚀 Anomaly Detection & #Cloud
📌 #VictoriaLogs Roadmap
🌍 Community #News + AMA
Don’t miss it! 🎉
https://t.co/BcWWmmnnPC
#TechEvents #TechMeetup #Observability #Monitoring
Just rewrote the "Quick Start with VictoriaMetrics Kubernetes Operator" section. Now tailored for newcomers to both VictoriaMetrics and Kubernetes.
Would love your feedback, especially if you're just starting out!
#VictoriaMetrics#Kubernetes#DevOps
A shout out to our colleague Yury Molodov for contributing this new functionality to the Prometheus ecosystem:
Heatmap visualization for histogram buckets 😎
See the details of the pull request here: https://t.co/PI36KEXjHk
I want to thank the #VictoriaMetrics team for creating a proper interface for debugging metrics and relabelings (perhaps it was always there, I just didn't know).
Check out the new templating feature in
@VictoriaMetrics#Grafana datasource utilizing the power and flexibility of WITH templates
https://t.co/eiqx3AZG4E
Starts today: @Percona Live kicks off in Denver & we look forward to meeting you there if you're attending!
Come say hello in the Community area of the exhibition hall & get kitted out with our new t-shirts & hoodies 😎
With thanks to @IgorsTshirtsCO#perconalive#opensource
@linuxnetdata Agent is great for infrastructure & apps #monitoring!
With VictoriaMetrics it lets you store metrics in a centralized place & use them for alerting & visualization with the same tools as for other metrics from various sources.
See how: https://t.co/AgSIQ0CzUB
Releasing Graphite Query Language in Open Source VictoriaMetrics 😎
Get all benefits of using #OpenSource VictoriaMetrics while retaining the Graphite protocol for data ingestion & querying #timeseries!
Read the blog post for details: https://t.co/N3V3EE1ifu #Monitoring
Our v1.87 release has been built with Go1.20!
It shows up to 5% performance improvements in data ingestion benchmarks compared to the previous VictoriaMetrics release built with Go1.19 🚀
Have you seen similar improvements?
#golang
Stream parsing mode!
This latest vmagent feature lets you immediately cancel in-flight scrape requests during configuration reload, which speeds up configuration significantly!
See here for details: https://t.co/RvmgKSSgDE #opensource#timeseries#database#monitoring