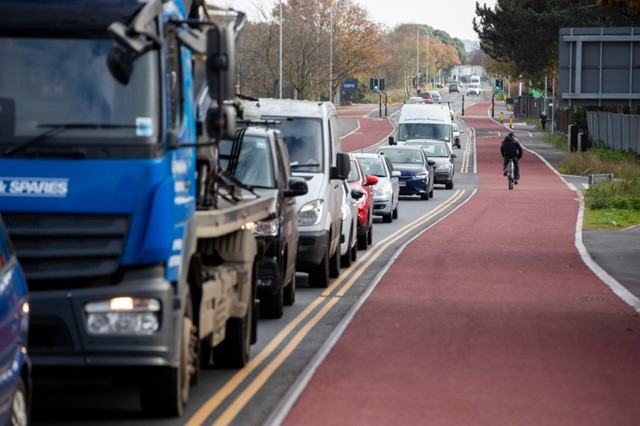
🤨 "Several people have already driven out of the barracks and almost hit cyclists because they don't realise it's a cycle lane as there is a lack of markings or signage."
Genuinely perplexing🥴
@BCPCouncil more, not less, of this please!
https://t.co/h67RyHHxBL
#cycling
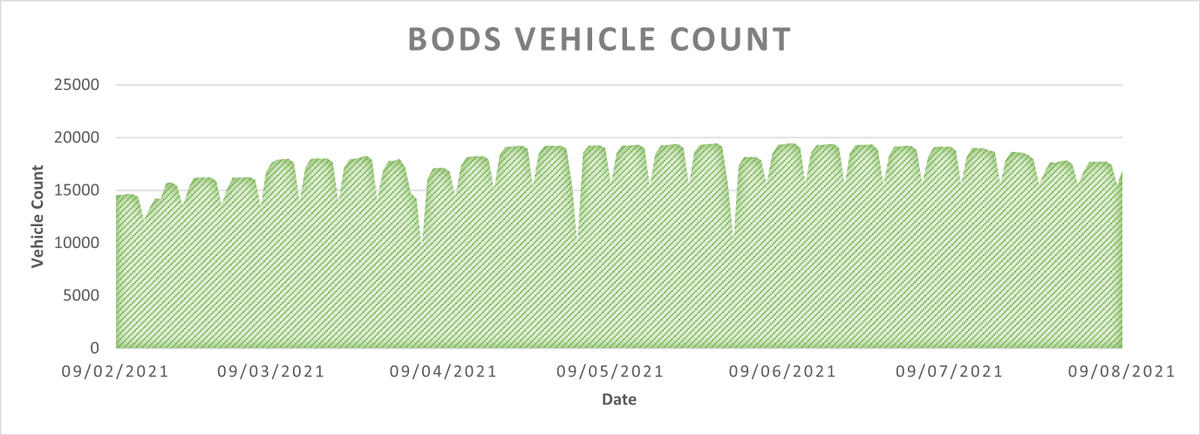
This is such a simple chart of the daily vehicle counts from #BODS, but I love the regularity of the pattern, and the ability to see the early adoption rising + regular weekend dips and three clear bank holiday dips through the year.
@busopendata#simplepleasures#data#transit
Good to see this getting focus and coverage:
🚲 Bikes had higher average speed
📦 Bikes dropped off 10 parcels p/h vs. 6 for vans
💨 Carbon emissions cut by 90%
🌳 Air pollution significantly reduced
#cargobikes#transport#sustainability#airquality
https://t.co/s7r2rlB663
We have another @gonortheast#dataviz from Newcastle for you 🌉 An evolution on our last @busopendata occupancy video, it shows the net change in bus filling and emptying over the course of a week - learn more here #BODSisBeautiful: https://t.co/97TnCmxZEd
Small changes make big impacts.
"Urban residents who switched from driving to cycling for just one trip per day reduced their carbon footprint by about half a tonne of CO₂ over the course of a year."
#activetravel#emissions#ClimateCrisis#mobility
https://t.co/MJo7BEL6bs
"We’d make better progress if we identified the correct problem: not gas, but cars."
👏🏻
This article really hits the nail on the head!
🚙 ➡️ 🚶♀️🚴🏾♀️🚌🚊🚅
https://t.co/aeSfz6F9Mu
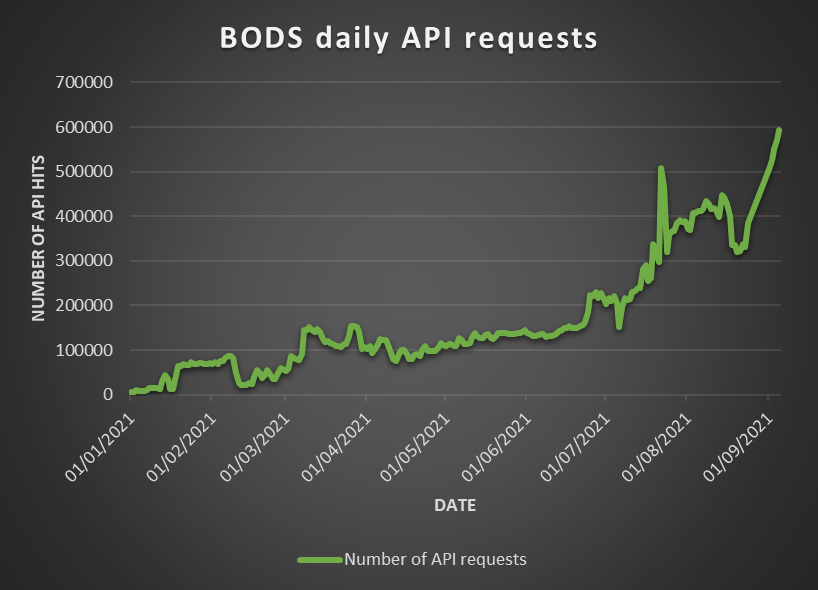
The more data in the #BusOpenData service, the more we, and others, can do innovative, amazing and - in this case - beautiful things with it ☺️
Looking forward to see what others do!
➡️ Access BODS data here: https://t.co/sSOblBvPuB
#BODSisBeautiful#DataVisualization#MaaS