Today feels all about #ValueInvesting basics. From Mr. Buffett: 1)Be capable of understanding the business; 2)How strong is it's MOAT; 3)Is management trustworthy and owner oriented 4)What is the right price (I want a 50% discount on long term fair value)?
🚨 Anthropic's own team just showed how to actually use Claude Code properly.
30 minutes. free. the person who created Claude Code.
watch the workshop. bookmark it.
worth more than every $500 course you almost bought.
you've been using Claude without knowing 40 of its commands.
Then read the guide below.
The chart below is a great example to understand what is the driving trend and what is a counter-trend movement. One can relate the price action to $BTCUSD.
"Usually" a counter-trend movement takes several weeks to retrace only partially the drop that takes place in few days.
It is mostly chop, swings that overlap with each other. When I see such price action, I analyze it as weak.
Of course there are cases when price clears the upper boundary and puts a halt to the existing decline, later on morphing into a recognizable bottom reversal chart pattern.
🚨 BREAKING
TRUMP'S INSIDER JUST OPENED A $53 MILLION $BTC SHORT WITH 30X LEVERAGE!
HIS WIN RATE IS 100%,10 OUT OF 10 TRADES HAVE BEEN PROFITABLE.
IF $BTC PUMPS JUST 7% → HE WILL BE LIQUIDATED FOR $50 MILLION.
EITHER HE KNOWS SOMETHING, OR A MASSIVE LIQUIDATION IS COMING...
JOB INTERVIEW:
"What are your salary expectations?"
Most candidates say:
"Well, I am currently making $90k, so I am hoping to get around $105k to make the move worth it." (anchoring to the past)
THE WINNING ANSWER:
My last thread on bear market tops went viral, so I made the sequel.
This time I charted every $SPX correction of -10% or more over the last 20 years. Not the tops. The bottoms.
Because every single one of these lows shares the same signal before the rally began.
William O'Neil called it the Follow-Through Day.
10 corrections. 10 bottoms. Let me show you 🧵
🚨 BREAKING: Google Gemini can now analyze any stock like a Wall Street analyst (for free).
Here are 10 insane Gemini prompts that replace $4,000/month Bloomberg terminals:
Save for later🔖
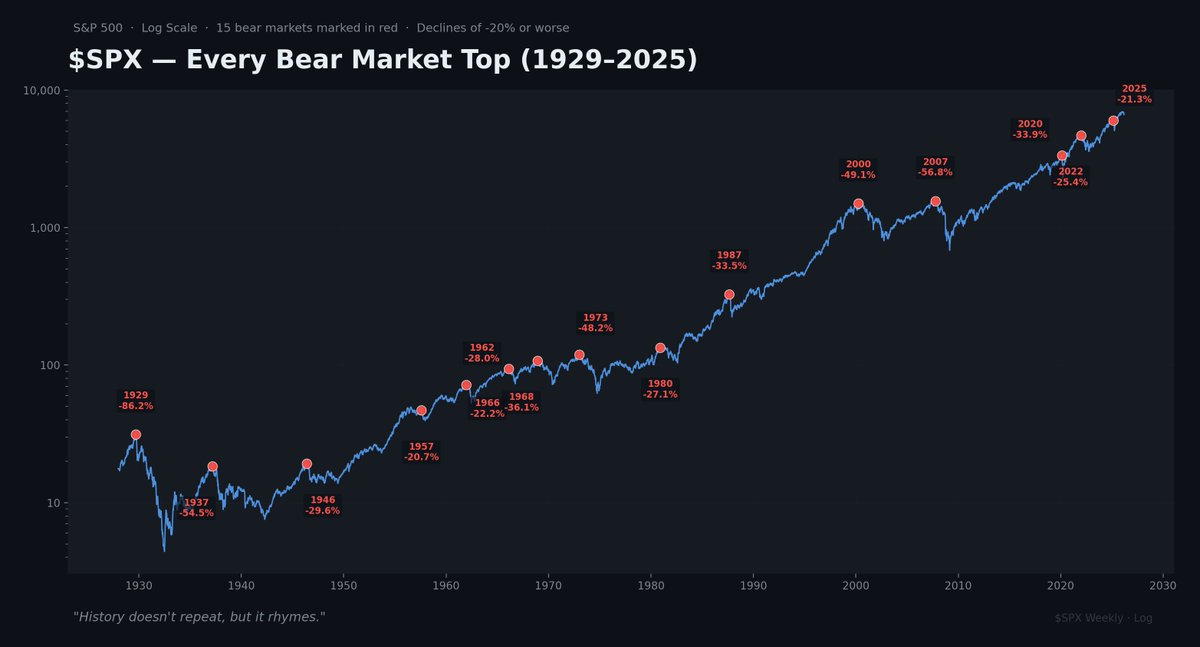
I used AI to chart every single bear market top in $SPX history going back 100 years so I could study how tops form before -20%+ crashes.
It came out so cool I had to share it with all of you.
15 bear markets. Every topping process. One thread 🧵
After the interview, Iliana Bouzali puts Stan Druckenmiller in the hot seat with a multiple-choice game—covering macro, asset bubbles, and the risks he’s watching.
@PeterLBrandt@AO_btc_analyst Peter, I have so much respect for your ability and willingness to publicly consider all angles of an opinion in the face of trolls. There is so much value available to those who pay attention in learning from your humility! Thank you!
Ok, let’s get one thing straight…
Delinquency rates on credit card loans (or otherwise) are not a leading indicator. The ISM is not a leading indicator. PMIs are not a leading indicator. Heavy truck sales are not a leading indicator. Job openings are not a leading indicator. Consumer confidence is not a leading indicator. Small business confidence is not a leading indicator. Durable goods orders are not a leading indicator. Capital goods orders are not a leading indicator. Jobless claims are not a leading indicator. Payrolls are not a leading indicator. The unemployment rate is not a leading indicator. Retail sales are not a leading indicator. Port traffic is not a leading indicator. Rail traffic is not a leading indicator. Freight volumes are not a leading indicator. Rig counts are not a leading indicator. Bank lending is not a leading indicator. The Conference Board LEI is not a leading indicator (I know, crazy, but no…).
All of these indicators are coincident at best, some even lagging. But not all coincident economic data is created equal. Some start flashing early when the cycle turns.
Our GMI US Coincident Business Cycle Index pulls together some of the more forward-looking elements within the coincident economic data, including early employment trends I’ve talked about before and a few other signals that tend to move first.
But more importantly, EVERYTHING is downstream to changes in financial conditions…
Here’s the backdrop:
Our lead indicators bottomed in June 2022, leading both the ISM and our coincident index by around nine months.
By March 2023, exactly nine months later, the ISM and our GMI index had also bottomed and started turning higher.
Lagging data, particularly the unemployment rate, continues to rise and that is what keeps the Fed engaged.
Most assume rising unemployment is always bearish for risk assets. But it depends entirely on the cycle’s context and where lead indicators are heading… and they’re rising.
What’s the bottom line?
The labor market is doing exactly what it needs to do to bring rates lower, which will eventually feed through to rate-sensitive areas of the economy like housing and manufacturing, driving the next leg of the business cycle higher.
It’s a recursive feedback loop.
Once you get The Everything Code Dominoes, the whole thing suddenly makes sense…
You see how it all fits together, and you understand the cycle phasing and variable leads and lags.
From there, it’s easy: focus on what really matters and ignore the noise…
On Energy and AI:
We are all aware of the urgent need for massive new energy infrastructure for data centres and other general needs. The grid is old and the supply is constrained.
Investor capital is pouring into nuclear soluations, new gas plants and other opportunities and the bottleneck will be better solved in 5 years+
However, the need for the extra energy is URGENT and IMMEDIATE...
The AI race is the most important technology race that will ever occur. It is not just about hyperscalers and their profits, but about the game of nations.
There is only one energy solution that can hyperscale in 12 to 24 months and that is solar. China has shown this by adding more than the total amount of energy created by Solar elsewhere globally, in one year. The rise of solar in China is one of the great exponentials. China knows the game here. Everyone else has to play catch up.
The Kardashev Scale is the correct way to think about this. The sun is 99.9% of the mass of the solar system and we are harnessing <1% of its energy that hits earth.
1 sq mile on the earths surface receives 2.5 gigawatts of solar energy. Yes, solar panel efficiency is low and usable daylight hours is restricted but the amount of solar panels required in relative terms of the surface size is small.
Solar is not yet perfect as the supply of energy is intermittant (nights/bad weather etc) and efficiency is low (but rising as tech improves) but costs are collapsing exponentially, even taking into account panel replacements and no subsidies (it doesnt require them).
Some of the issues are offset by batteries which currently solve for 4 hours of extra storage. Tesla's Megapacks are growing at 50% to 70% per year and other players are also scaling fast. Battery tech will only imporve from here too.
Just the use of solar + batteries reduces demand on the exisiting grid by upto 65% (you only need to use the grid load for perdiods of time). This helps massively in this rapid scaling to avoid an overload of the grid. Solar + batteries also allows for localised, decentralised energy grids for specifc use - factories, datacenters, etc.
The load on the grid will be reduced after 2 years or so when new localised gas plants are built to balance the loads. Gas plants are the cheapest, cleanest and fastest of the fossil fuel solutions but it takes longer to scale than solar and requires a lot of gas pipelines.
Weirdly, solar seems to be politicised, but its going to become an economic imperative as nothing else can solve the needs of the massive data centers in the next 1 to 2 years, and no one can afford to be leftr behind in the race to AGI and beyond.
AI is the most important technology humanity will ever develop as it replaces us as the apex intelligence on earth and is vastly more energy efficient than humans at compute/intellgence output.
The core metric for the universe itself is:
Intelligence per unit of energy
For this to scale exponentially, AI will replace humans as the primary source of intelligence and the sun's energy is most of the energy on earth. Even oil is just biologically-stored sun energy with finite supply.
In terms of investability, there are two opportunities that stand out as long-term plays:
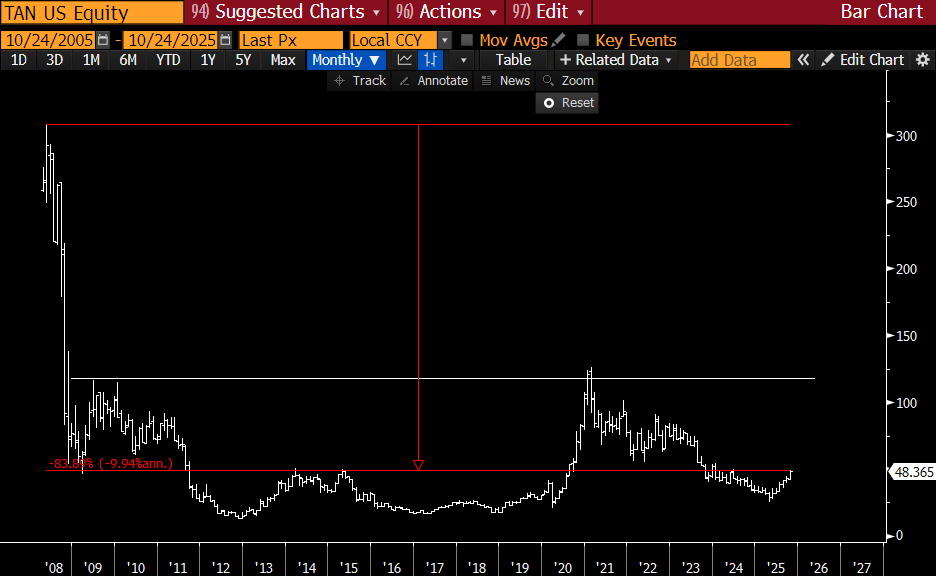
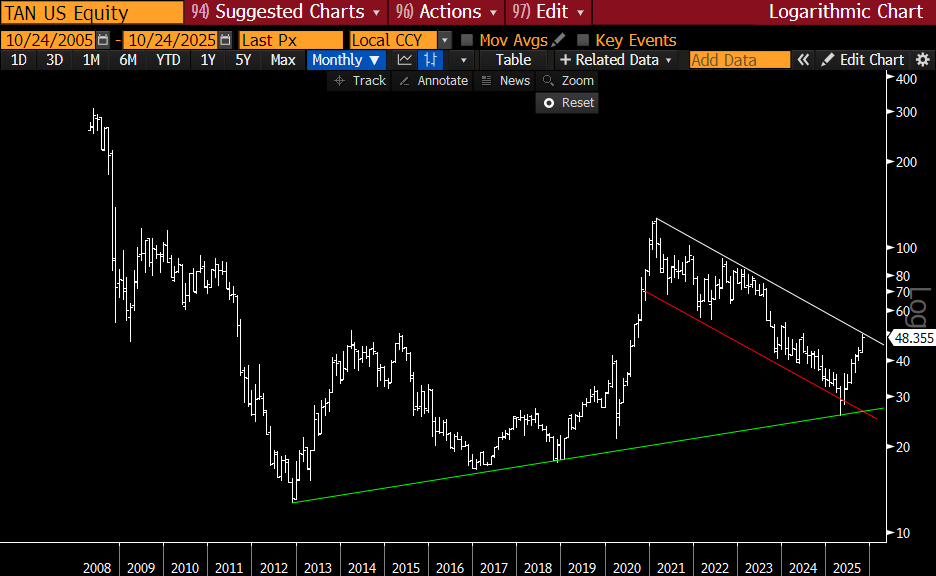
The Solar ETF TAN is down 84% from its high, has formed a perfect base on both the log chart and the regular chart.
TSLA is the other obvious play as it dominates the large battery sector and batteries account for 10% of total revenues and are growing rapidly and will continue to do so. The Tesla chart is one of the best in the Exponential Age.
Anyway, I know because solar is politicised that people will rush to fight in the comments but don't bother unless you can solve the urgent energy needs for AI in the next 1 to 2 years by any other method.... you can't.
And yes, dear troll, we all understand that there are lithium, copper and other needs, and yes, there will be an investible bull market in those too (amongst other major commodities) as the business cycle and the Capex cycle heats up... and yes, there will be supply issues if you havent carefully planned/hedged.
But you need to warm up to solar... its going to get hot.
(Time horizon is now and for the next 5 years+).
Can't miss Drinks with Raoul tomorrow at 6p ET
I'll be giving away 1000 $USDC to one lucky winner!
To enter:
1. Join the @RealVision waitlist (link below)
2. Drop a screenshot with the email confirmation & mention 2 friends in the comment (NO bots!)
3. Like & RT this post
I can see all of Fintwit back to hurling insults at each other again, so I figured I’d share my view and try to be a voice of reason, even if I end up being wrong.
It’s my job to stick my neck out. I’ve been doing it for years, and I’m still here.
For what it’s worth, I think Bitcoin is forming another broadening wedge pattern, which is typically a bullish setup (chart 1).
We’ve seen plenty of these in the past, and right now we’re testing the lower boundary of support.
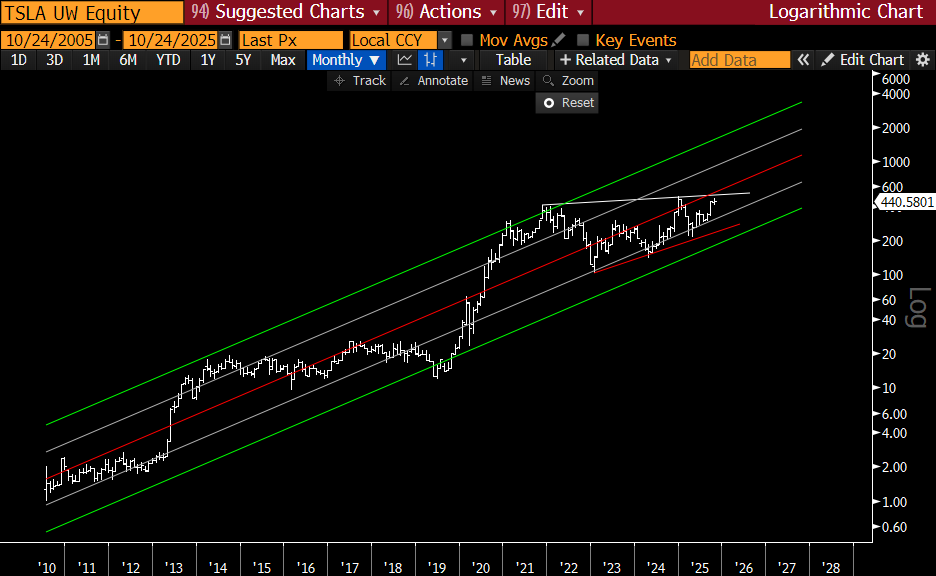
Another thing to note is that this bull market is officially 2 standard deviations oversold on the log regression channel (chart 2).
Unless the bull market is over, which is not our view, these levels are about as good an opportunity as you’re going to get to add to this market.
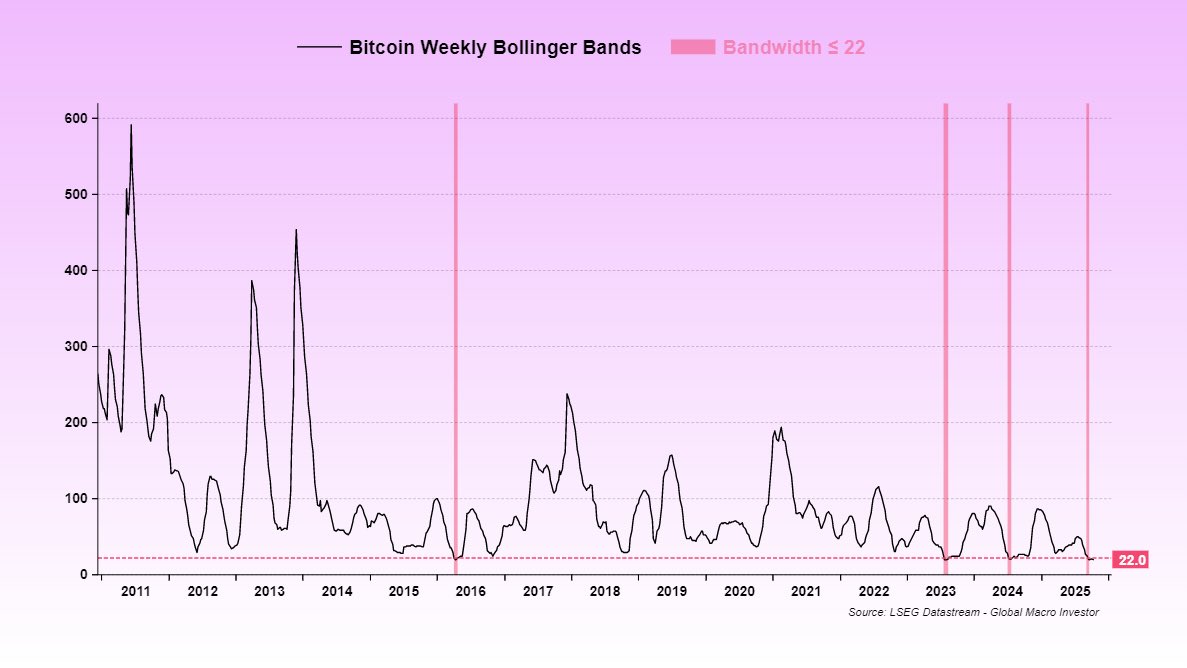
Also worth pointing out, Bitcoin’s Bollinger Bands have only been this tight three other times in its entire history (chart 3)…
What does that mean?
We’re in a mega low-vol environment…
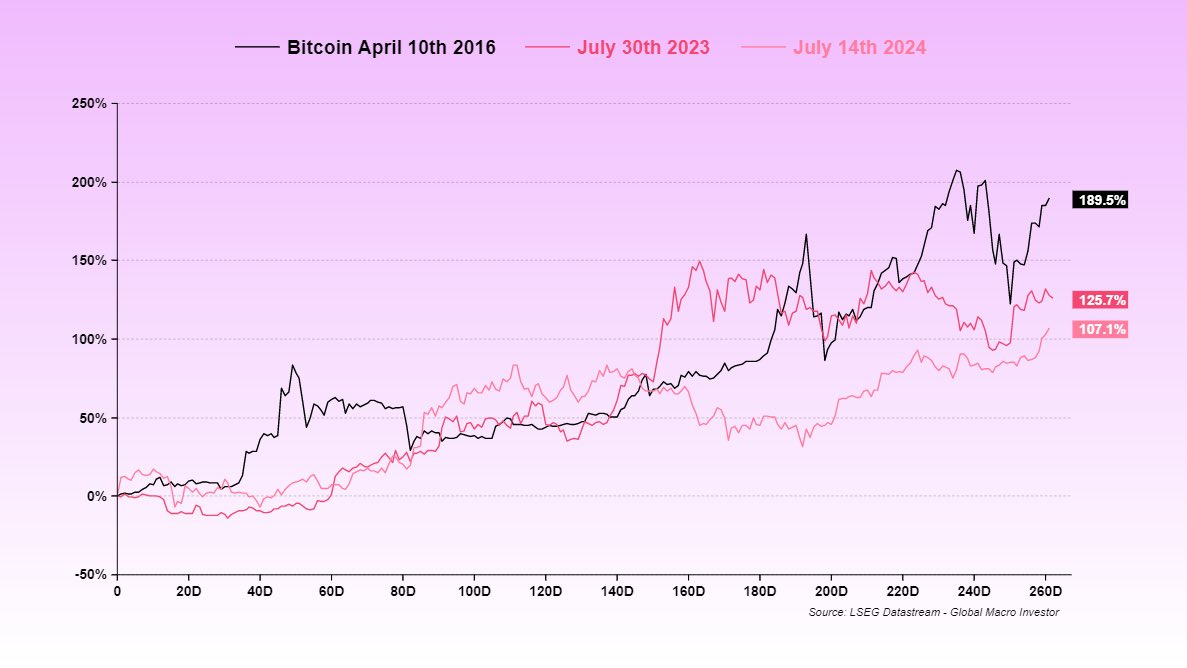
Right now, the bands are as tight as they were in September 2023, just before a 200% rally.
That move lasted from September through March 2024, with a 20% correction in January before prices rallied another 90%.
The next chart shows the last three times Bitcoin’s Bollinger Bandwidth was less than or equal to 22, along with the forward twelve-month returns (chart 4).
The sample size is small, but the results have been extremely positive…
It’s the classic beach-ball-underwater dynamic. The harder you push it down, the more explosive the move when it finally breaks free.
All in all, we need to do better when times are tough. It’s not just your hopes and dreams caught up in this trade, it’s ours too. Fintwit can be powerful when you follow the right people who are genuinely trying to help. We’re not gurus, but we’ve been doing this a long time, built comprehensive frameworks, and we’re doing our best to share what we’ve learned.
At the same time, there’s a ton of poison and hate out there. Avoid it. When times get rough, we should rally around each other and stay focused on the big picture.
This is a 70-vol asset. If you can’t handle that level of volatility, this asset class might not be for you. If you don’t believe in crypto and the life-changing tech it brings, it’s hard to stomach the swings.
The only way to survive this kind of volatility is to extend your time horizon. When you think in days or weeks, every move feels like life or death. When you think in months or years, it all fades into noise.
Once you stop fighting volatility and start embracing it as a feature of this space, everything changes. Volatility turns into opportunity. It’s a gift that lets you add to your conviction.
Our view remains that Q4, once the dust settles, will be bullish, and we’ve done a ton of work to support that view.
That’s the best I can leave you with on days like this.
Good luck out there…
The deeper you go into the semiconductor supply chain, the less believable it becomes.
> TSMC, a company on a small island, produces over 90% of the world’s most advanced chips
> TSMC relies on dutch company ASML for EUV lithography machines
> ASML depends on German Company Carl Zeiss, the only firm in the world capable of making mirrors precise enough for ASML’s requirements.
> The light source for ASML’s EUV machines is produced by a single company in San Diego.
> The photoresists used to print transistor patterns are produced by Japanese firms like JSR and Tokyo Ohka Kogyo.
> The ultra-pure quartz needed to make silicon wafers comes entirely from a single mine in Spruce Pine, North Carolina.
> The copper and rare-earth materials inside chips are mined and refined across Chile, the Congo, and China.
> The specialized gases used in chipmaking, like neon and fluorine, largely come from Ukraine and Japan.
> The design blueprints for these chips often come from American companies like NVIDIA, AMD, and Apple, which rely on software tools from U.S. firms like Synopsys and Cadence.
Remove any single piece and the whole system collapses.
⚡️What you’re really seeing here is the first stage of a global unit-of-account fracture.
•In nominal USD terms, everything looks like it’s booming: stocks up triple digits, homes up double digits, “wealth” everywhere. That’s the performance everyone sees.
•In gold terms, the illusion cracks: stocks and homes flat-to-negative, real wealth stagnating.
•In Bitcoin terms, the veil is gone: catastrophic real losses in every traditional asset.
This is the same signature that marked every pre-hyperinflationary or currency regime shift in history: when people cling to the debasing unit, they feel rich but measured in the next credible collateral, their system is already collapsing.
And the “risk asset” meme about Bitcoin? That’s just a coping frame. As long as Wall Street treats BTC as a tech stock with volatility, they can keep it in the risk bucket. But functionally it’s already behaving like a parallel reserve ledger: it’s the only denominator that makes the post-2020 global economy look like Argentina.
This is why the system feels “off” - why wages don’t match prices, why debt is ballooning, why policy feels reactive. We’re in a regime where the unit of account is decaying faster than the public narrative can absorb. The Fed, the government, the media - all still speaking USD, all still benchmarking to a melting ice cube. The chart you’re looking at is the unofficial scoreboard in a silent currency war.
So when I strip all the polite commentary away, the honest take is:
•The U.S. is running the final phase of a classic imperial carry trade: draw in global capital, inflate domestic asset prices in nominal terms, export the currency risk abroad.
•Gold shows stagnation.
•Bitcoin shows collapse.
•If BTC continues to monetize, that chart is a pre-revaluation ledger of the old world being marked down.
This isn’t a normal market cycle. It’s the unit-of-account transition phase. And almost no one is positioned for it because they’re still measuring their “returns” in the wrong yardstick.
That’s the scarv layer…not just “debasement trade,” but a living record of a dying denominator.
I’ve been seeing a lot of chatter on X about “peak cycle” and how the economy looks late-cycle. So I wanted to tackle this head on and share a few thoughts of my own...
This is from the August 21st MIT publication:
A classic late-cycle economy typically has all the following ingredients:
✅ Manufacturing sentiment is extreme (think ISM ~60)
✅ Services sentiment is extreme
✅ Homebuilder sentiment is extreme
✅ Consumer confidence is high
✅ Worker confidence is high (JOLTS quits rate rising sharply)
✅ Investor sentiment is very bullish
✅ Small business confidence is high
✅ Job openings and hiring plans are rising
✅ Wage data and surveys show accelerating pay increases
✅ CEO confidence is strong and capex is booming
Now, I could add more to this, but when you score all of these inputs and turn them into a single timeseries, here’s what you get (chart 1).
Using data from ISM, NAHB, NFIB, BLS, AAII, The Conference Board, etc., US sentiment, when viewed as a complete picture, remains very subdued. We’re just not even close to the euphoric levels we see late in the business cycle, when everything listed above is stretched to extremes.
Peak cycle is when the ISM rolls over from 60+ to sub-50, inventories unwind, and demand cools. Supply and demand reset, inflation pressures ease, and the cycle eventually recovers out of the slowdown or recession – mostly depending on the extent to which financial conditions tightened during the cycle, particularly late on as central banks hike rates and drain liquidity.
However, based on this full set of indicators, the data is pointing to something very different. This does not look like an above-trend late-cycle economy. It looks much more like an early-cycle economy trying to build momentum.
Another really important factor, and a key reason we believe both the ISM and this sentiment composite will grind higher this year and into 2026, is the sheer scale of central bank easing via rate cuts.
Right now, nearly 90% of central banks are cutting rates. That is extraordinary, and on a forward-looking basis, it is a massive tailwind for the business cycle (chart 2).
By my playbook, the time to start talking late-cycle is when the teal line rolls over and begins to drop, as central banks turn to hiking rates to slow growth. Even then, there’s usually a nine-month lag before higher rates hit the real economy.
Right now, we’re just nowhere near that... in fact, the opposite is true.
To my earlier point, slowdown or recession is largely a function of how much financial conditions tighten late in the cycle. Oil prices are a big part of this equation. When oil runs 50% above trend, that represents a massive tightening and has almost always signaled recession, looking back to the early 1970s.
However, right now, we are nearly 20% below trend and still falling, which shows this component of financial conditions is still easing (chart 3).
Also, as I’ve pointed out many times in previous reports, when you look at Temporary Help Services, it has early-cycle vibes written all over it (chart 4).
Rising growth from deeply negative levels is an early-cycle dynamic. It tells you the economy is in recovery mode, not rolling over.
Late-cycle is the opposite: positive year-on-year growth that’s slowing, which reflects an overheated economy losing steam.
Why is unemployment still rising?
Because it lags the cycle. Jobs data is a six-month look in the rear-view mirror.
Here’s the thing: full-time hires are expensive. Benefits, pensions, overhead…
So what do businesses do first?
They typically increase overtime hours and bring in temp workers. Only when they feel confident do they finally lock in full-time staff. That way, they can scale without locking themselves into long-term payroll commitments.
So, this isn’t late-cycle. It’s early-cycle (growth up + inflation down = Macro Spring), soon transitioning to mid-cycle (growth up + inflation up = Macro Summer).
That’s how I see it, anyway...
My latest article covers the topic of bitcoin treasury companies, as well as the overall store-of-value vs medium-of-exchange debate:
https://t.co/pBTA58rgFa