HR & Compensation Analyst transitioning deeper into Data Analytics | Excel, SQL, Power BI & Python | Sharing my journey, projects & beginner-friendly lessons
Hi, I’m Jeremiah 👋 A Statistics grad and HR C&B Analyst building deeper in Data Analytics with Excel, SQL, Power BI & Python.
I’ll be sharing my journey, projects, lessons and practical insights from HR, payroll and business data. Let’s connect 🤝
#DataAnalytics#Excel#SQL
Small Excel discovery today!
Ctrl + ; inserts today's date, while Ctrl + Shift + ; inserts the current time.
It's amazing how small shortcuts can make everyday data tasks easier.
Still learning, still practising, still moving on my Data Analytics roadmap. 🚀
#Excel#Data
Today I learned SQL JOINs using HR data
INNER JOIN: matching records
LEFT JOIN: all records from the left table
RIGHT JOIN: all records from the right table
FULL OUTER JOIN: all records from both tables
I also practised joining 3 tables: employees, departments & salaries.
#SQL
SQL Joins are just Set Theory in disguise
INNER JOIN = Intersection (A∩B)- Only the overlap
LEFT JOIN = Set A (A) + matching right
RIGHT JOIN = Set B (B) + matching left
FULL OUTER JOIN = Union (A∪B)- Everything together
Math🤝SQL!
#DataScience#SQL#Analytics#TechCommunity
Every time I receive an Excel file, the first thing I do is select all sheets and unhide. 😂
I think I picked up this habit from someone in finance. Now it's automatic!
What's your Excel habit? 👀
#Excel#DataAnalytics
Today I learned how SQL CASE WHEN works.
Think of it like Excel's IF function.
WHEN checks a condition
THEN returns a result
ELSE handles everything else
END closes the logic
I also practised COALESCE() for handling NULL values.
One step at a time.
#SQL#DataAnalytics#data
SQL Tip #1:
WHERE filters rows.
HAVING filters groups.
WHERE → before GROUP BY
HAVING → after GROUP BY
Took me a while to understand the difference, but it finally clicked today.
#SQL#DataAnalytics#LearningInPublic
Today I learned how LIMIT and OFFSET work in SQL.
LIMIT controls how many rows I return, while OFFSET tells SQL where to start counting from.
Small concept, but useful for working with large datasets.
#SQL#DataAnalytics#LearningInPublic
Yesterday, I learned a simple Excel trick that makes a BIG difference. 🔥
🔒 Locking cell references with $
A2 → changes
$A$2 → stays fixed
A$2 → locks the row
$A2 → locks the column
Shortcut: F4
Small skill, big impact. 📊
Still learning. Still building.
#Excel#Data
Excel just made me look stupid this morning 😂
I wanted to freeze the first 2 rows and first 2 columns.
Turns out, all I needed was to select C3 → View → Freeze Panes → Freeze Panes.
Small lesson, but I learned something new.
#Excel#Dataanlytics
Over the past few days, I've been building my Excel foundation- data cleaning, XLOOKUP, Power Query, PivotTables, charts, and What-If Analysis.
Next stop: SQL.
Starting with SELECT, FROM, WHERE, ORDER BY, and LIMIT.
#SQL#DataAnalytics#LearningInPublic
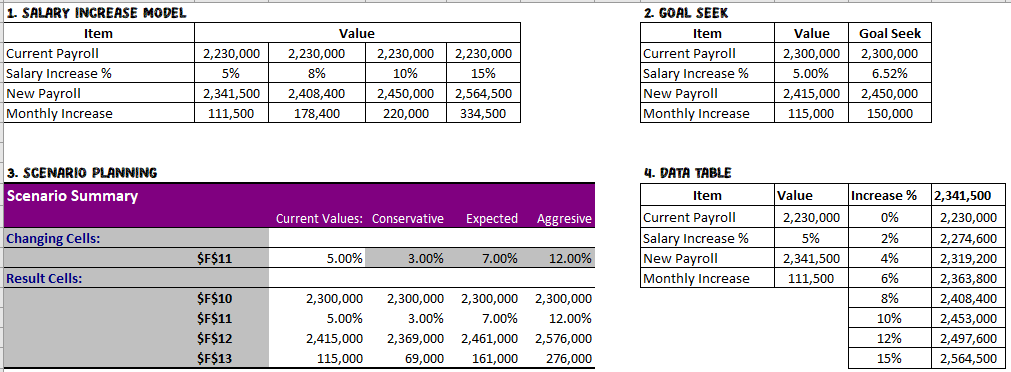
Built a salary increase model and explored Goal Seek, Scenario Manager, and One-Variable Data Tables.
I'm starting to see how these tools can support payroll budgeting and HR decision-making.
#Excel#HRAnalytics#LearningInPublic
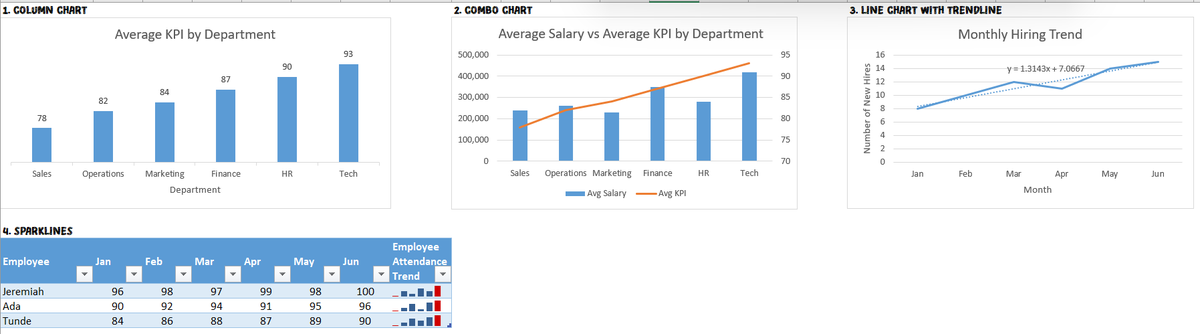
A good dashboard isn't about adding more charts-it's about choosing the right chart to tell the story.
Today's practice covered Column Charts, Combo Charts, Trendlines, and Sparklines using HR data.
What's your favorite Excel chart for dashboards?
#Excel#Data#HRAnalytics
What-If Analysis: I learned that Goal Seek works backward to find an input, Scenario Manager compares different outcomes, and a One-Variable Data Table tests multiple values at once.
I can already see how useful these are for HR budgeting and payroll planning.
#Excel#Data
A chart isn't useful because it looks good- it must communicate the right message.
Mistakes I'm learning to avoid:
• Wrong chart type
• Too many colors
• Missing titles/labels
• Unclean data
Better charts = clearer insights.
#Excel#DataAnalytics#LearningInPublic
Another Excel win: Line chart shows what actually happened. A trendline reveals the overall direction, and the equation lets you estimate future values if the trend continues.
It's a simple feature, but it adds much more context to data.
#Excel#DataAnalytics#LearningInPublic
Built a simple HR dashboard in Excel using Conditional Formatting, Data Bars, Color Scales and Icon Sets.
Small formatting changes make reports easier to read and highlight key insights. Every project is improving my Excel and HR analytics skills.
#Excel#HRAnalytics#Data
Dynamic Named Ranges and Excel Tables both expand as data grows. Tables (Ctrl + T) are simpler, while Dynamic Named Ranges use INDEX and COUNTA.
I'm learning both.
Tables for modern workflows and Dynamic Named Ranges for legacy Excel files.
#Excel#DataAnalytics
I created a Performance column with Excellent, Good & Needs Improvement and tried using Traffic Light Icon Sets. It didn't work.
Lesson: Icon Sets only work with numbers, not text. Changing the values to 3, 2, 1 fixed it.
#Excel#DataAnalytics#LearningInPublic
PivotTables are becoming one of my favorite Excel features.
Today I turned raw sales data into a summary report by grouping, filtering and comparing product performance-all without writing a formula.
I can see why they're essential for data analysts.
#Excel#PivotTable#Data