Transform to Survive — but Don’t Transform to Die
Balancing today’s core with tomorrow’s bets: eight principles for leading transformation without breaking your company
https://t.co/fwrIRKf5kQ
Maybe, the first interactive visualisation was done by Frenchman Jacques Barbeu-Dubourg in 1753.
He created a 16-meter long timeline showing 140 years of world history, which can be mechanically scrolled and folded for transport. Unbelievable!
I've always wondered what happens to a bullet after a seemingly safe shot into the air. Can it cause damage when it falls? Now I have an answer with great visualization and storytelling
https://t.co/Q0jR3GWMTK
⚽️ With the #EURO2020 approaching, you've probably all been wondering what ~1 million of passes would looks like if all shot at the same time, right? Well wonder no more...
Thanks @StatsBomb for making the data openly available!
@observablehq notebook https://t.co/dO4sfQpRi4
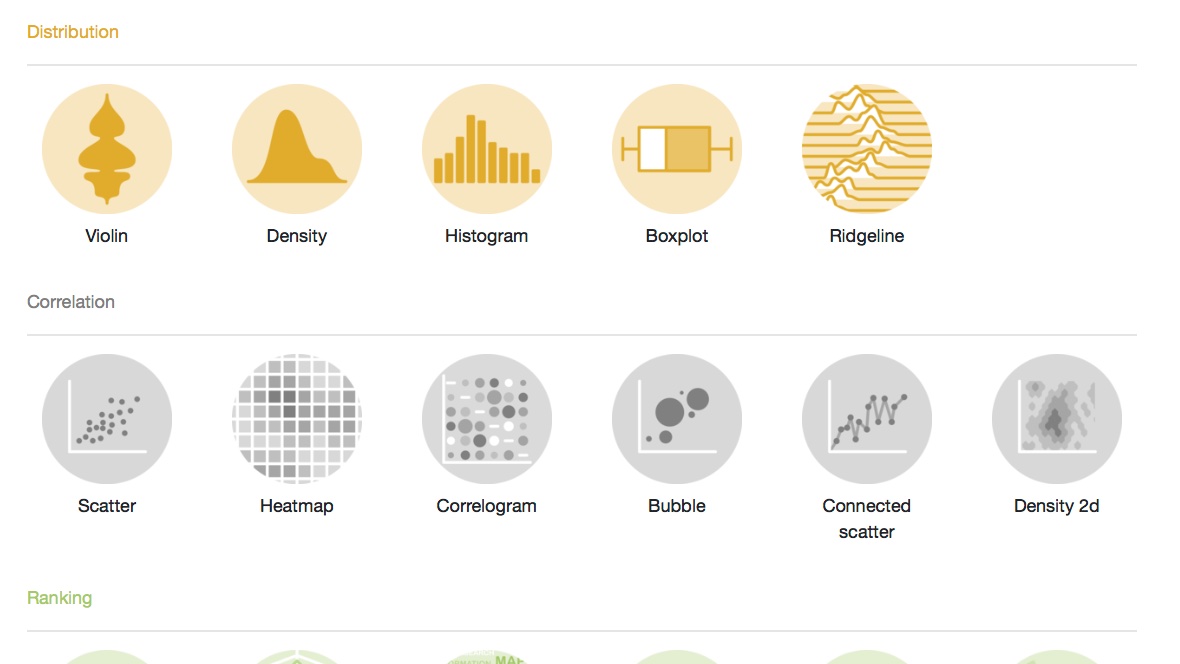
👋👋I'm looking to improve the https://t.co/37QCKbhZfg with good #rstats chart examples from the web (with code). 🧐
➡️Any blogpost you know I should feature? Thanks!! 🙏