go pull up the 6AM candle on your chart right now
this one candle predicts the entire New York session direction
and almost nobody uses it
a guy in my discord called 14 out of 15 trading days correctly last month using only this
here's the exact system:
THE 6AM REVERSAL SIGNATURE:
at 6AM EST, institutions show their hand
they either:
- push price into a key level (reversal incoming)
- expand away from a level (continuation day)
the 6AM candle tells you WHICH
STEP 1: mark yesterday's high and low
STEP 2: at 6AM, watch where price trades relative to those levels
STEP 3: if 6AM sweeps a level but CLOSES back inside the range = reversal day
STEP 4: if 6AM expands and closes BEYOND the level = trend day
that's it.
EXAMPLES:
6AM sweeps yesterday's high, closes back below it → sell the rip at 9:30
6AM sweeps yesterday's low, closes back above it → buy the dip at 9:30
6AM breaks high and closes above with momentum → only look for longs
most traders show up at 9:30 with no bias
they're "reacting to price action"
aka gambling
smart traders showed up at 6AM
they already know the direction
the 9:30 open is just their entry window
THIS IS THE EDGE:
institutions set up the move between 6-9:30
retail shows up at 9:30 and provides the exit liquidity
you can either BE the liquidity
or you can TAKE the liquidity
the 6AM candle tells you which side you're on
go backtest it. 30 days. track the results.
you'll never trade blind again
free discord in bio
(DM "SYSTEM" for fully private 1-on-1 coaching - this is a high ticket offer, i only take 1-2 traders at a time)
INSTEAD OF WATCHING A 2-HOUR MOVIE.
Watch this Anthropic Claude for Finance lecture.
It’s probably the best free hour in quant AI right now.
Bookmark it and watch it today, no matter what.
INSTEAD OF WATCHING AN HOUR OF NETFLIX TONIGHT.
This 1 hour Stanford lecture by Joel Peterson will teach you more about negotiation and getting what you want than most people learn in years.
Bookmark it and give it an hour, no matter what.
How to spot a stock’s “change of character” moment:
The answer is in the chart. 6 pizza slices:
1) the trend flips
- lower highs + lower lows...flips to...higher lows + higher highs
- the first HL is typically my signal
- look @ the annotated chart I attached
2) relative volume
- shows increased interest
- well above 200day RVOL baseline
- subtle, but clear volume pops at first
3) breaking of key levels
- price pushes though prior resistance
- prior resistance becomes support
- breakout holds
4) laggard to leader
- former laggard starting to lead
- relative strength improves
- feels like it's always green on red days
5) new reaction to pullbacks
- dips bought faster
- pullbacks become shallower
- can't break support
6) bad news is shrugged off
- negative headlines are still bought
- strong reactions to any news
- any selling = absorbed
It's all about behavior. Know when it changes.
Example below: $NBIS.
Feel free to bookmark + keep,
- Luc
After 3 years of using Claude, I can say that it is the technology that has revolutionized my life the most, along with the Internet.
So here are 10 prompts that have transformed my day-to-day life and that could do the same for you:
The person who built Claude Code just showed exactly how to use it.
30 minutes. Free. Straight from Boris Cherny himself.
Bookmark this before you forget. Most people using Claude daily are missing 40+ features hiding in plain sight.
This single session is worth more than any $1000 course.
Trap reading (is it gonna be bull or bear trap) for #smallcaps#trading. Based on my prior posts this week and why observing micro-clearouts in structure is key. It makes some % difference in read quality on stocks. Been deploying this method for years.
Critical spot for the market here me thinks.
One of those areas where 'unexpected' things can happen considering the geopolitical yo-yo that's ongoing.
I'm opting for team upside if we get a sufficient weekly closure. Max pain is most certainly up. I stick to my thesis this is a mid-cycle correction and inevitably things are going to get crazy very soon.
Most are now sidelined and waiting for lower. Most capitulated in the Jan-Feb decline, unable to see past the next candle. Record numbers of realised losses on-chain through November 2025 to Jan 2026 specifically. As always, many adapt to current directions once it's already too late. The reason the bear thesis sticks for most people is because:
1) They didn't see it coming and reacted at max pain threshold
2) They have exited and now need lower
3) Herd mentality attracts herd mentality
4) Influencers went full bearish and must now stick to their claims
and for me personally:
5) Public complaint volume. angry posts, "they're wrong about everything" reviews, hate DMs to anyone holding a bullish view peaks at exactly the wrong moment. It's one of the most reliable contrarian indicators in markets and it flashed the worst I've ever seen in February, where the bottom was marked.
I have been spot on and not so spot on - https://t.co/elf31PXAsu
At the time of calling the liquidation event, I was under heavy ridicule. Then it happened, I received the utmost praise. Then we went lower, many turned on me again.
The concept of the ATH correction projection, was to turn the narrative into one where many believe we are now in a bear market. Similar to May 2021. Things seem worse because BTC exceeded 6 figures. I was really looking at 80K as the worst of it, but that extra 20K decline actually helped strengthen the bias mostly due to the:
1) worsening sentiment
2) altcoin positioning
3) on-chain metrics
I highlighted this in detail in the last video — https://t.co/bul1ZbVzGK
That title was deliberate. The on-chain metrics that triggered are real... but they're the ones that historically only fire at peak extreme cycle bottoms. The signals were screaming extreme downside deviation at the exact moment they always do: maximum opportunity, not maximum risk.
Naming the video the way I did meant anyone scrolling past would click expecting me to finally throw in the towel. Instead they got the breakdown of why those signals firing at 60K meant the opposite of what the headline implied. BTC's run 20K since.
The current reversal from 60K is an excellent showcase of how human emotions can help dictate a stronger conviction in the markets.
If you're looking for herd mentality backing and conviction, you get it at ATHs.
If we have seen record realised losses and capitulation, that means record numbers of spot buying was done beyond 80K. You cannot expect rational opinions when it's coming from those that executed at the height of irrationality.
The liquidation event itself was annoying. All of my targets struck on alts with a swift blow across most exchanges... but not on Kraken. Tried to buy on Binance at peak liq lows, "server overload" or some nonsense.
I had a choice to make in that moment...
- Don't buy and Binance wicks marked complete bottom, leading to missing out completely.
- Buy with an acceptance of going into drawdown, to keep DCA'ing if we fill the liquidation wicks.
I opted to buy, hold the drawdown and keep buying.
I'm not selling the alts I bought into the liq event, I haven't stopped buying since then. I bought them with a clear thesis, accumulate cycle bottoms, hold the drawdown, target the move into alt season. Every move lower is an opportunity to acquire more coins for less. Nothing about the structural picture has changed.
The percentage moves that hurt on the way down work the same way on the way up. Unfortunately you cannot assist everyone in seeing that perspective.
If anything, whilst BTC has gone much lower, most alts that suffered brutally during the liquidation event have just gone back to those lows to fill the wicks on exchanges that suffered the greatest. That in itself is an incredibly good sign and something to cross-reference with where BTC has formed its local bottom. In many circumstances with structure like this, alts provide the reading.
As with all my views, nothing is coincidental in the markets. I believe most of this has been an intentional and brutal wipe out ahead of the clarity act, which paves the way for the initial phase of the BTC-dominated cycle to rotate into the altcoin-ending phase of the cycle with the regulatory green light. A quick glance at altcoins already tells you the 4-year cycle is logically not following the same principles.
Coins going lower do not mean they're dead, everything has gone lower irrespective of their fundamentals or partnerships. A multi-year altcoin bear market means an equally greater opportunity is present as they reach the bottom and phase out of their bear markets. Unlike previous cycles, this is happening where BTC trades around its previous 2021 cycle ATH.
Logically... Considering the scope of what's happening geopolitically, it would be foolish to ignore present risks and not have an understanding of the implications if something does unfold.
This is routine for me. My bias, projections and focus is on a HTF trend reversal initiating (which it is), this doesn't mean I do not look at where the market can go beforehand and how to act accordingly. Preparation is vital.
We're at a crucial window here where the market still has a chance to see one of those classic bottom-marking wipeouts that would of course be driven by the narrative of war. I do not necessarily expect this, but I can see where the news would take price if it was deployed here. Think COVID, FTX, etc.
The breakout we have seen to 80K has shifted us out of the bearish structure from the 125K high. This already sets the scopes back towards 100K+ overall.
A sudden wipeout of this nature would provide those who didn't get in an excellent opportunity to position themselves. Realistically, most still wouldn't pull the trigger in such a scenario because the underlying fear driven by the narrative causing it would only reinforce the ideology of it going much lower.
Personally, I would rather this doesn't happen, but I will use it to buy more if the chance is granted. The truth is, there's been sufficient time to accumulate assets effected by this decline, so seeking lower is a derivative of greed at this point. Unfortunately, this is a common practice for the market. An aggressive sell-off, full of leveraged shorts with little upside pullback, usually leads to an equally greater force when the upside comes back into play. Most have no choice at that point but to enter much higher once it's too late.
Understanding the opposing side before the desired side helps me stay calm in the wildest of moments. I like to keep my specific conviction and understand the depths of where things can go in the event there's no immediate continuation to the desired areas in the short-medium term, this pullback would be exactly that.
If you don't create such boundaries and understand how to utilise it, you will full victim to the same emotional traps 99% of crypto traders do when volatility is paired with an equally volatile narrative.
Realistically, it's what everyone is waiting for, so hopefully that in itself is enough of a reason it doesn't need to happen.
We are long overdue some real upside action. Sufficient time going lower and sideways is an excellent device for making the majority forget just how crazy things get when the tide turns. Time based capitulation is equally as powerful as declining capitulation.
The pain in crypto can last months to years.
The gain can last just several weeks to months.
Your goal is to ensure you capture as much of the limited-window gain as possible. That doesn't come from joining once the market is already in that window.
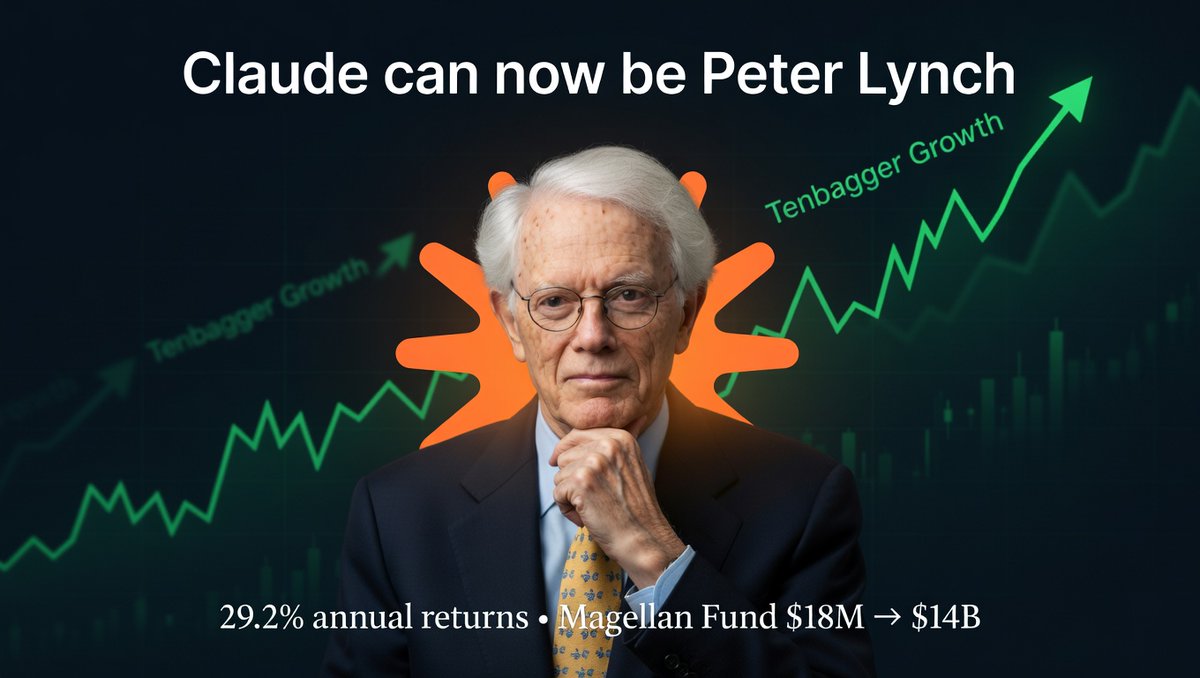
Claude can now be Peter Lynch.
The legendary Fidelity manager who delivered a blistering 29.2% average annual return and grew the Magellan Fund from $18 million to staggering $14 billion.
Now sitting right in your Claude window, ready to deep dive on any stock.
Save this for later.
Here's the quick 5 minutes setup guide:
BREAKING: I asked Claude to upgrade my LinkedIn profile.
It didn’t just “upgrade” it. It turned it into a recruiter magnet.
Here are the exact 7 prompts I used:
The best buying opportunities of the last 10 years all came from the same spot:
The retest of the previous bull market high.
2020
2022
2025
Now it’s at 611
Don’t believe me just look at the Weekly $SPY
R.I.P. WORKING FOR SOMEONE ELSE.
$100 a day is $3,000 a month.
$3,000 a month is your freedom number.
Claude gets you there faster than anything alive right now.
Here are the 5 prompts that start the whole thing:
❤️❤️Thanks all for joining in Huge Numbers!
Here is the latest Documentation
Hopefully you guys learnt a lot and implement it Life Changing Ripster Clouds System!
Special Thanks @TrendSpider
Link to All Scripts->https://t.co/TuuEX4yEsi
Get TS-> https://t.co/rKdlqPI7Sd