ex-IG multi asset strategist, macro analysis and all things tech, venture, blockchain, crypto and igaming🚀 My comments are not financial advice. Always DYOR!
Aging is arguably the root cause of most major diseases (loss of function in our cells). Four years ago, we made a bet that aging was treatable, and NewLimit was born.
NewLimit now has a prototype drug that reverses the age of some human cells (restores function they had when they were younger), and a clinical trial scheduled for next year (with more drug candidates in the pipeline).
Grateful to Founders Fund, Thrive, Greenoaks, and the rest of the investors for this latest round. @jacobkimmel and the team are just getting started.
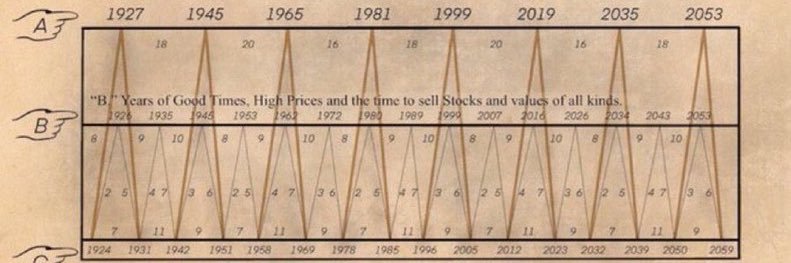
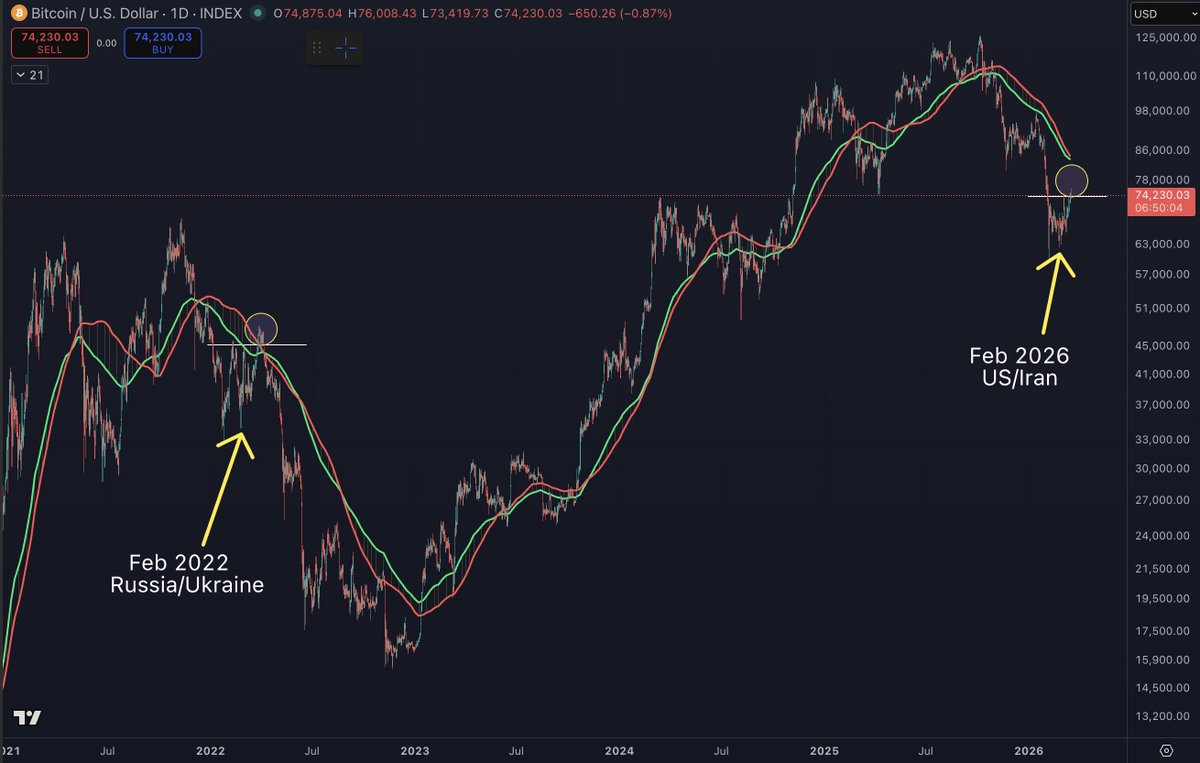
Plausible path:
Bitcoin forms a low in June (like it did in June 2018 and June 2022).
BTC rallies in July
SPX correction later in year which allows Bitcoin to finally bottom (most likely October)
Four year cycle wins again
⚡️ INSIGHT: Warren Buffett sees limited opportunities in current market, waiting for a major dip to deploy capital.
Berkshire Hathaway holds a record $382B in cash reserves as of Q4 2025.
🚨 NOW: The US dollar's share of global foreign currency reserves has fallen to its lowest level this century, dropping to nearly 40%, per Bloomberg Intelligence.
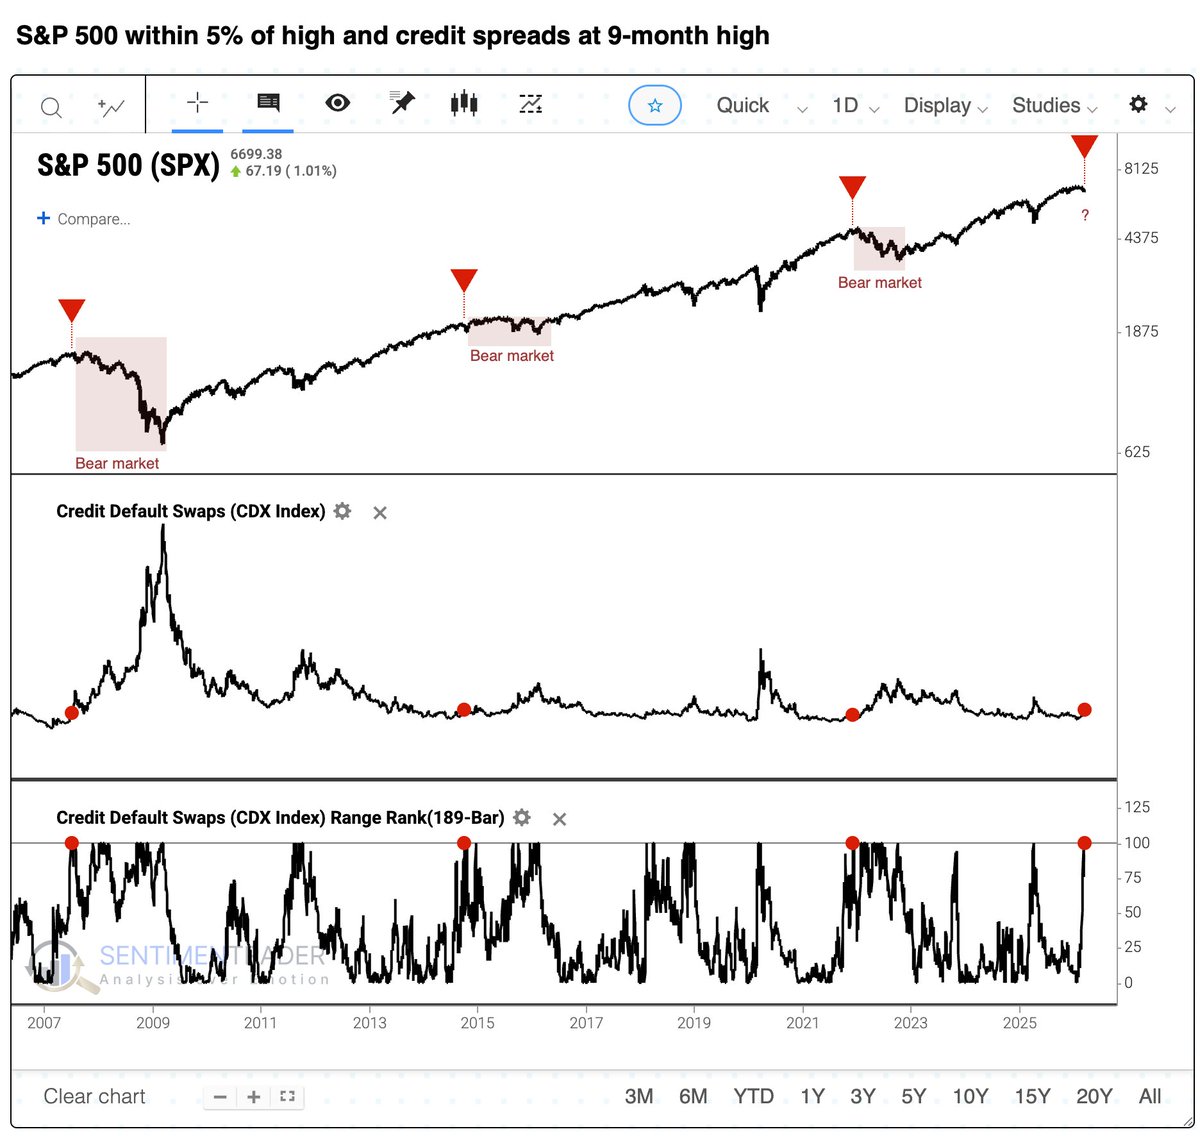
The bond market is getting twitchy.
Over the past 20 years, when credit spreads blew out but the S&P 500 wasn't even beyond a pullback yet, it was 3-for-3 in bear markets.
h/t @sentimentrader
Most business cycles of the past have ended shortly after the price of oil spiked.
Rising geopolitical conflict threatens to cause that once again.
If oil starts moving higher, it usually marks the beginning of the end of the business cycle.
Interesting read, certainly something to consider. Even somewhat aligns with the business cycle views I expressed here:
https://t.co/Ao19CL9d25
I think there is a reason to believe the current business cycle will end within the next 2-3 years from a liquidity point of view.
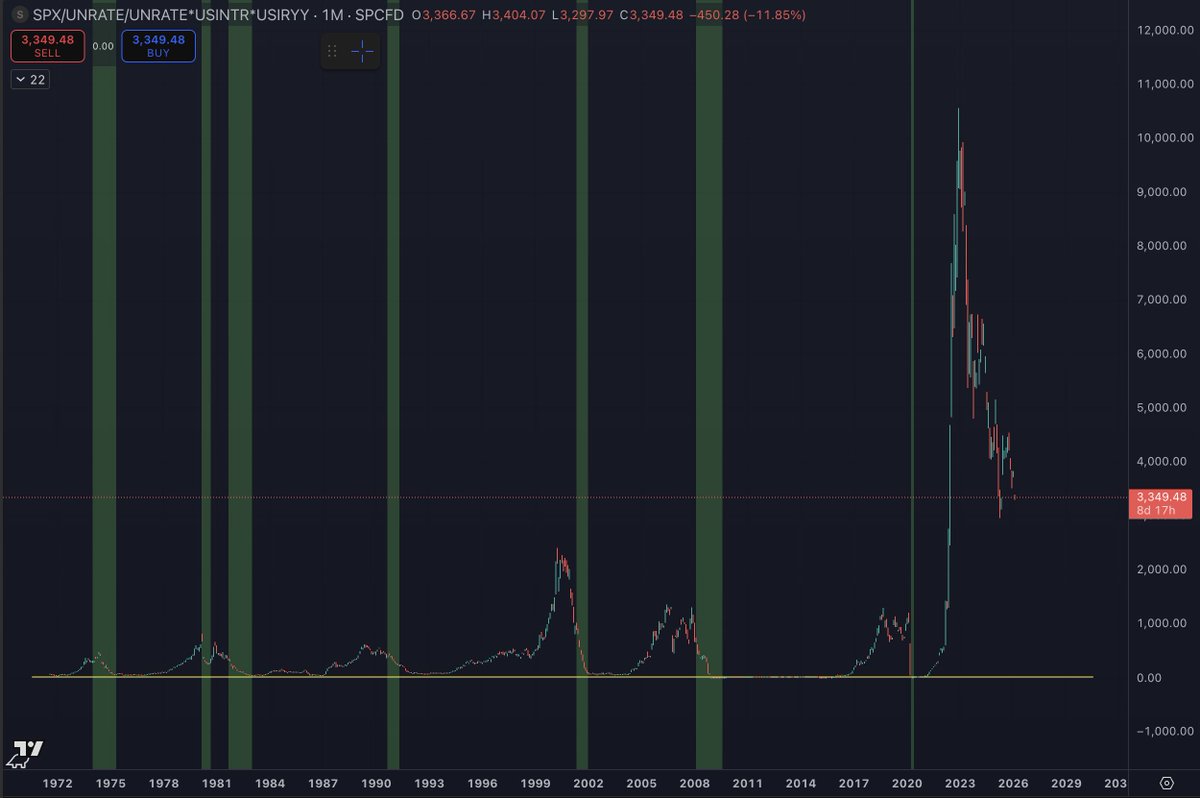
I have mentioned this chart a few times in the past, but it does really go to show just how extreme things got the last few years.
The chart is SPX/(UNRATE^2)*USIRYY*USINTR
Unravelling things after extreme euphoria is never an easy process.
As things have been unwound over the last several years, most markets have gone higher on hopes of a soft landing. But there has generally been a flight to quality within each asset class as people buy what they better understand and think has value long-term, rather than short-term speculative investments.
Unwinding euphoria has never been an easy or a fun process, but it is a process we have been going through for the last several years.
As liquidity and monetary policy has stayed relatively tight the last several years, it has led to a general flight to quality within each asset class.
This is why BTC outperformed most other things in crypto and why the MAG7 generally led the S&P 500.
Starting out far on the risk curve, altcoin weakness was observed first as they bled to BTC for years.
Then as the BTC bull market came to an end, BTC was noticeably bleeding to SPX.
Then it became apparent that SPX was bleeding to Gold (which it already had been but more people started to notice).
Notice how we are basically just working our way down the risk curve?
As this chart falls back down to prior support levels, it represents us going back to normal times.
What I love about this chart is that you can clearly see each business cycle and how every single one of them ended in a recession before the next business cycle began.