Why is A4 paper called A4? 'Cause of #Math
A4 is 1/2 an A3, 1/4 of A2 & it’s 1/16 of A0 which has an area of 1 m² (but it isn’t a square).
They all have an aspect ratio a/b = √2, so each one can be scaled to other sizes without being distorted
Designing large-scale systems usually require careful consideration of caching.
Below are five caching strategies that are frequently utilized.
🔹 Read Strategies:
Cache aside
Read through
🔹 Write Strategies:
Write around
Write back
Write through
The caching strategies are often used in combination. For example, write-around is often used together with cache-aside to make sure the cache is up-to-date.
Over to you: What strategies have you used?
–
Subscribe to our weekly newsletter to get a Free System Design PDF (158 pages): https://t.co/FIzCeaWsZV
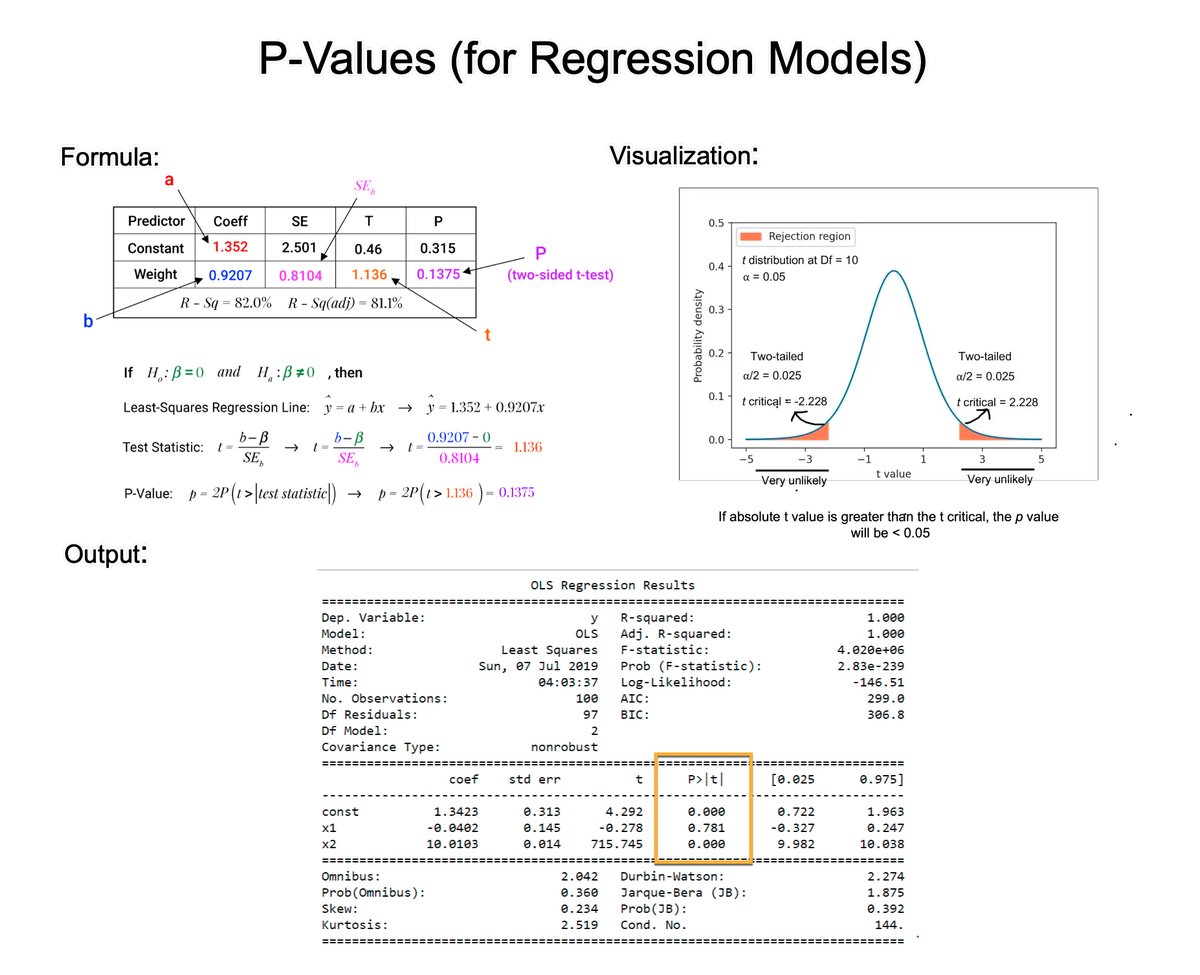
Understanding P-Values is essential for improving regression models. In 2 minutes, learn what took me 2 years to figure out.
1. The p-value: A p-value, in statistics, is a measure used to assess the strength of the evidence against a null hypothesis.
2. Null Hypothesis (H0): This is a general statement or default position that there is no relationship between two measured phenomena or no association among groups. For example, the regressor does not affect the outcome.
3. Alternative Hypothesis (H1): This is what you want to test for. It is often the opposite of the null hypothesis. For example, that the regressor does affect the outcome.
4. Calculating the p-value: The p-value for each coefficient is typically calculated using the t-test. There are several steps involved. Let's break them down.
5. Coefficient Estimate: In a regression model, you have estimates of coefficients (β) for each predictor. These coefficients represent the change in the dependent variable for a one-unit change in the predictor, holding all other predictors constant.
6. Standard Error of the Coefficient: The standard error (SE) measures the accuracy with which a sample represents a population. In regression, the SE of a coefficient estimate indicates how much variability there is in the estimate of the coefficient.
7. Test Statistic (T): The test statistic for each coefficient in a regression model is calculated by dividing the Coefficient Estimate / Standard Error of the Coefficient. This gives you a t-value.
8. Degrees of Freedom: The degrees of freedom (df) for this test are usually calculated as the number of observations minus the number of parameters being estimated (including the intercept).
9. P-Value Calculation: The p-value is then determined by comparing the calculated t-value to the t-distribution with the appropriate degrees of freedom. The area under the t-distribution curve, beyond the calculated t-value, gives the p-value.
10. Interpretation: A small p-value (usually ≤ 0.05) indicates that it is unlikely to observe such a data pattern if the null hypothesis were true, suggesting that the predictor is a significant contributor to the model.
Understanding p-values can help improve your models.
But with changes in machine learning, there's a lot more to learn.
If you'd like to grow your skills and get a data science career, I’d like to help.
I put together a free on-demand workshop that covers the 10 skills that helped me make the transition to Data Scientist: https://t.co/LR39RJ5XKB
And if you'd like to speed it up, I have a live workshop where I'll share how to use ChatGPT for Data Science: https://t.co/EaMpKrJiqX
If you like this post, please reshare ♻️ it so others can get value.
📊 On Markov Chains 👇
🚨 I am planning to start live cohort classes where I am going to teach the basics of probability, statistics, some related mathematics which is necessary to master machine learning and data science. Comment below as well as DM me if you want to enroll 🙂
Which one is the best classification algorithm?
Don't forget this line:
'All models are wrong, but some models are useful.' - George Box
Here are 5 classification models to start with 🔽
Using in-memory databases for "integration" testing is a waste of time.
I've seen folks do this with the EF in-memory provider.
That's not even a real database.
So, what value can those "integration" tests have?
Zero, if you ask me.
Instead, spin up an actual database using Docker.
You can connect to this database from your tests.
And now you're writing proper integration tests.
This is even easier in .NET with the Testcontainers library.
Here's how to start working with Testcontainers: https://t.co/vijKp1nMeT
---
P.S. If you liked this, consider joining The .NET Weekly - my newsletter with 35,000+ engineers that teaches you how to improve at .NET and software architecture.
Subscribe here → https://t.co/2kGSP2ufoa
Time series analysis is a statistical technique that deals with analyzing and extracting meaningful insights from data points collected over regular intervals of time. Free pdf: https://t.co/o6heRxKUrE
#DataScience#rstats#DataAnalytics#statistics#DataScientists#DataViz
Time series analysis has been critical in my career. But it took me 3 years to get comfortable. In 3 minutes, I'll share 3 years of experience in time series:
1. Time Series Analysis: Time series analysis is a statistical technique that deals with time-ordered data points. It's commonly used to analyze and interpret trends, patterns, and relationships within data that is recorded over time (e.g. with timestamps).
2. Uses: Understanding and applying time series analysis concepts is critical for forecasting, detecting anomalies, and drawing insights on data that varies over time.
3. The 3 Core Concepts: There are 3 areas of time series that have been super helpful. Understanding 1. Autocorrelation, 2. Seasonal Decomposition, and 3. Calendar Effects. Let's break them down.
4. Autocorrelation: This refers to the correlation of a time series with its own past and future values. It measures the relationship (correlation) between a variable's current value and its past values.
5. Partial Autocorrelation: Autocorrelation has a problem. Some of the correlation is confounded by earlier lags. Enter Partial Autocorrelation. This removes the correlation effect of earlier lags.
6. Seasonal Decomposition (STL): Seasonal decomposition decomposes a time series into three components: trend, seasonal, and residual (irregular). STL stands for Seasonal-Trend-Loess. It uses a "LOESS" smoother to remove seasonal and trend effects. STL is flexible and can handle any type of seasonality, not just fixed seasonal effects. The residuals can be analyzed for outliers since they have been de-trended and de-seasonalized.
7. Calendar Effects: Calendar effects refer to variations in a time series that can be attributed to the calendar itself. This can include effects due to day of the week, month of the year, or holidays tied to the calendar.
Understanding and applying these concepts allows analysts to better forecast future values, detect anomalies, and draw insights from data that varies over time.
===
Ready to learn Data Science for Business?
I put together a free on-demand workshop that covers the 10 skills that helped me make the transition to Data Scientist: https://t.co/6Ji4GtOTzy
And if you'd like to speed it up, I have a live workshop where I'll share how to use ChatGPT for Data Science: https://t.co/Ydsmzv7trP
P.S. - If you are interested in time series, I have a High-Performance Time Series Course here: https://t.co/2H9HEuORi3
If you like this post, please reshare ♻️ it so others can get value.




![details_with_ai's tweet photo. Goodbye Manual Coding,
Stop wasting time on repetitive tasks!
10 #vscode extensions to streamline your coding workflow.
[Bookmark For Later] 🧵](https://pbs.twimg.com/media/GGmKG5ybEAAX5az.jpg)