Dedicated to mastering cryptocurrency and financial complexities to elevate financial well-being.
Stay informed on U.S. financial conditions, major stock moves
So combining these factors plus macroeconomics
1 US GOVT shutdown ends
2 FED ending QT on December
3 Trade deal between US China and tarrif relief
It is suggesting that BTC is ready for a new ATH
If I hava funds and want to invest I would invest some of my portfolio now to 86k
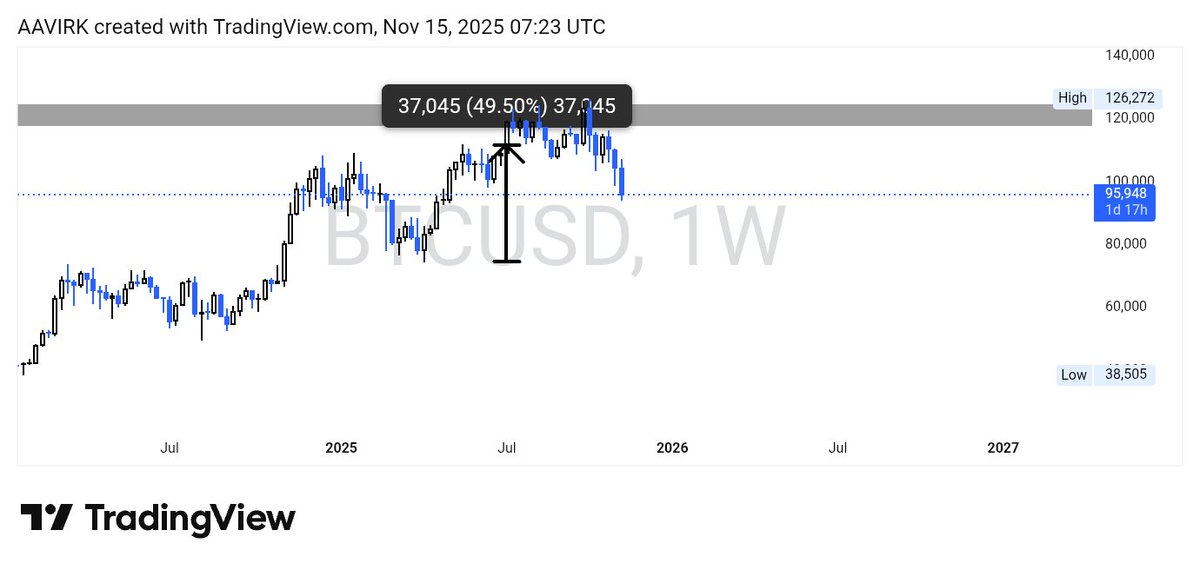
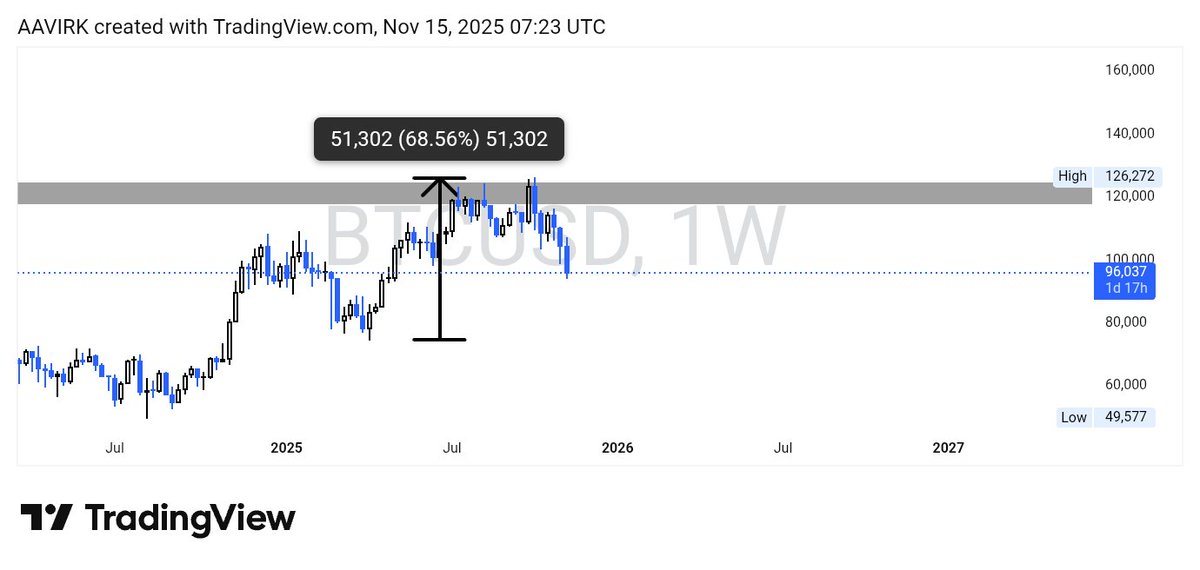
Now BTC HTF POI is between 86 to 92k zone,A weekly bullish FVG
And RSI on daily time frame is making a bullish divergence and on weekly time frame it is at key Support area
These are trend based fibs drawn from previous cycle lows
You can see it's accuracy in this cycle as it gave rejections from key levels
The next level is at 184 to 192k ,will BTC tap that level ,may be not but It can tap the 140K price tag or extension towards 150k a same pump
On 09 April2025 F&G index 15,Btc fell 30% from it's ATH that was 108k .Its price was 76k on 9 April it just fell to 74k after it and gained upward momentum and printed new ATH of 112k on 22May,just 43 days after 15 F&G index signals to buy with good amounts
Crypto Fear and Greed Index Fell to 16 indicating Extreme Fear,lowest since April 09 when it tapped 15.Well what does it indicates ??
What type of decision we can according to this index??
"Buy when there is blood on the streets if blood is your own"
Warren Buffet
🚨ALERT: BITCOIN NUP SIGNALS A BOTTOM!
The Bitcoin Net Unrealized Profit (NUP) is now at 0.476, showing selling pressure has eased. CryptoQuant suggest the market may be nearing a short-term bottom.
Yaah that's the onchain data,while every mentor,analyst is saying bear market has started ,data is suggesting something else,Yes We have losses Bitcoin and Ether Took a healthy correction but that's not yet Bear market . market needs catalysts
1 end of Shutdown
2 QT end on 1Dec
Onchain data is the proof that bear market hasn't started yet we can still witness BTC upside move but BTC can sweep Equal lows around 98900$ and bounce from 92 to 97k zone
Market momentum can also be gauged through the Realized Profit-to-Loss Ratio, reflecting investors’ net profitability.
The 90D-SMA sits at 9.4, marking a mild cooldown since July, yet still >2× higher than levels seen during the last two mid-cycle bear phases.
📉https://t.co/JVC6Pn9RKC