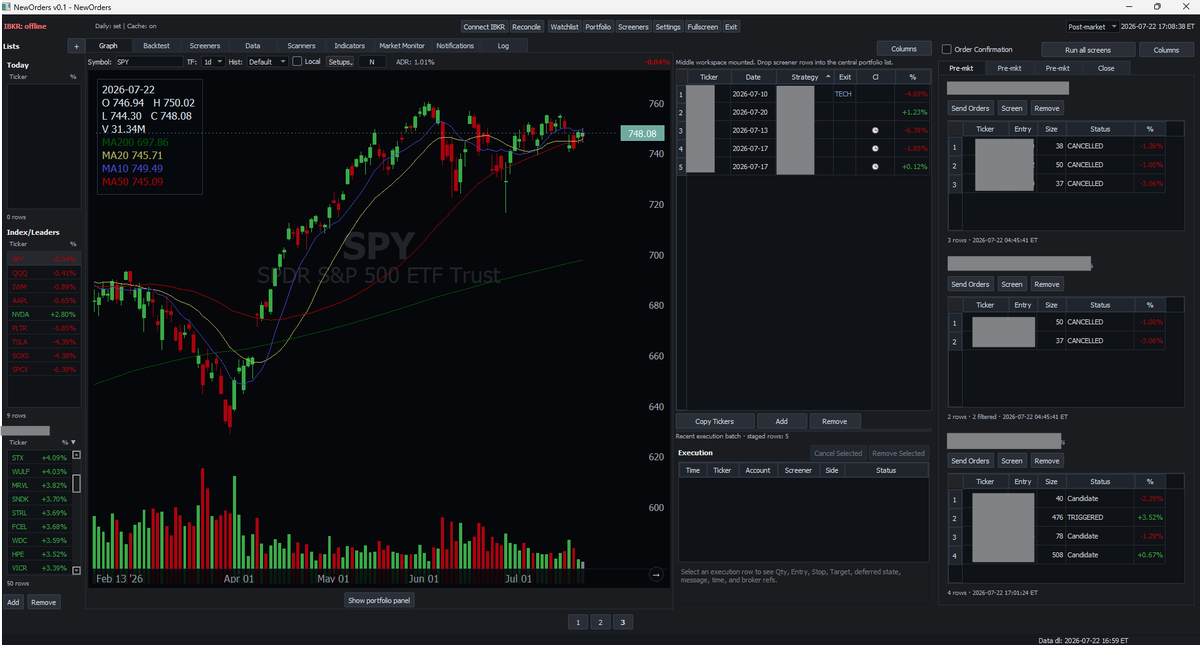
Quite happy with my "finished" layout of the platform. Very easy to use now from write and backtest single strategies to backtest a combined portfolio. Strategies are written in Python code in the platform and they can be deployed directly.
I can track missed trades, follow up live performance, automate all the screening and order submission.
I use Pushover for notifications to my phone so I can follow whats happening without being on the computer.
I'm adjusting my portfolio, tuning some strategies and lower risk on a couple of strategies.
A question to experienced traders like @pedma7@JoachimMo1985@Dan_Trend@momentmal22 or any other that I can't think of right now 😅
From 1999 up to and including 2025 my portfolio, in the backtest, have had a max drawdown of -24% and an annulized volatility of 26%.
2026 my portfolio, in the backtest, have had a drawdown of -29% and an annulized volatility of 37%.
During 2026 no individual strategy has had a deeper drawdown than during 1999-2025.
What conclusion can you make from this (if any)? Portfolio optimization is overfit maybe? Max drawdown or annulized volatility is expected to exceed backtested values?
I appreciate any input on this 😀
I have begun working on this with the help of all the amazing replys and advices I received.
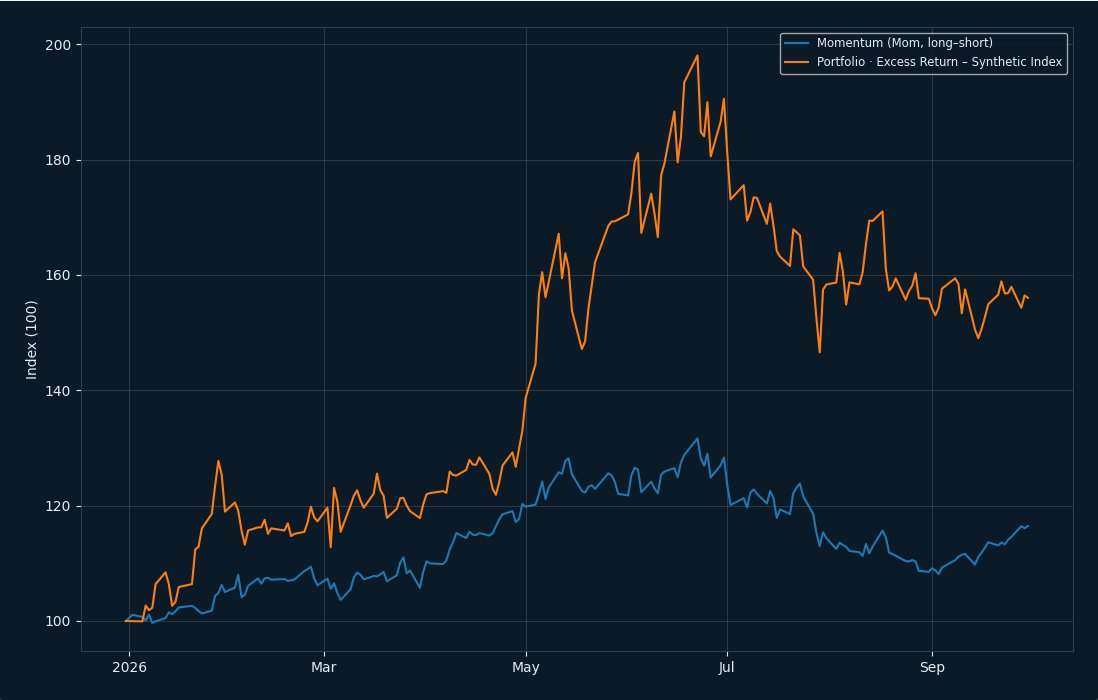
I think my first step is to get a good idea of where I am now and then make adjustments from there. The first thing I want to check is if my portfolio of strategies is doing what it is supposed to do. Therefore I have incorporated a benchmark model to my platform where I can compare the portfolio or individual strategies to a chosen benchmark.
This is my portfolio compared to Momentum long-short (Kenneth French).
My thinking is that this is what to expect from my portfolio. There are no warning signs from this - am I right?
If so, I think my next step should be to get a better picture of my risk and volatility. This I think is going to be a lot of work for me 😅😆
I'm adjusting my portfolio, tuning some strategies and lower risk on a couple of strategies.
A question to experienced traders like @pedma7@JoachimMo1985@Dan_Trend@momentmal22 or any other that I can't think of right now 😅
From 1999 up to and including 2025 my portfolio, in the backtest, have had a max drawdown of -24% and an annulized volatility of 26%.
2026 my portfolio, in the backtest, have had a drawdown of -29% and an annulized volatility of 37%.
During 2026 no individual strategy has had a deeper drawdown than during 1999-2025.
What conclusion can you make from this (if any)? Portfolio optimization is overfit maybe? Max drawdown or annulized volatility is expected to exceed backtested values?
I appreciate any input on this 😀
@momentmal22@pedma7@JoachimMo1985@Dan_Trend This is also very good inputs I think, thank you for taking the time to write!! I will bookmark and get back to this during my research 😀
Yes this resonates completely with me and I like that way of looking at it. Makes very much sense to me! I have been lacking severely here I think. My thesis has been to make systems of discretionary trading strategies, but I haven't had a good way of knowing how to evaluate them or knowing what to expect. Good thing is that I now have a lot of things to work on, both from your inputs as well as the other inputs. Thank you for taking the time 🍻
@pedma7@JoachimMo1985@Dan_Trend@momentmal22 Wow very good reply, thank you pedma! I will read it through a couple of times, bookmark it and get back to it. The factor benchmark is completely new to me and I will dig into it straight away.
@Dan_Trend@pedma7@JoachimMo1985@momentmal22 This is VERY good information Dan, I appreciate it a lot. I will bookmark this post and go back to it as I continue my reserching :)
Thank you so much for the detailed answer, I'll bookmark it and delve deeper into it.
You are right about semis, big portion is du the sell off in those. But my thinking is that similair events has happened in the past, e.g. sell of in internet stock after dot com. Maybe this sell of was faster?