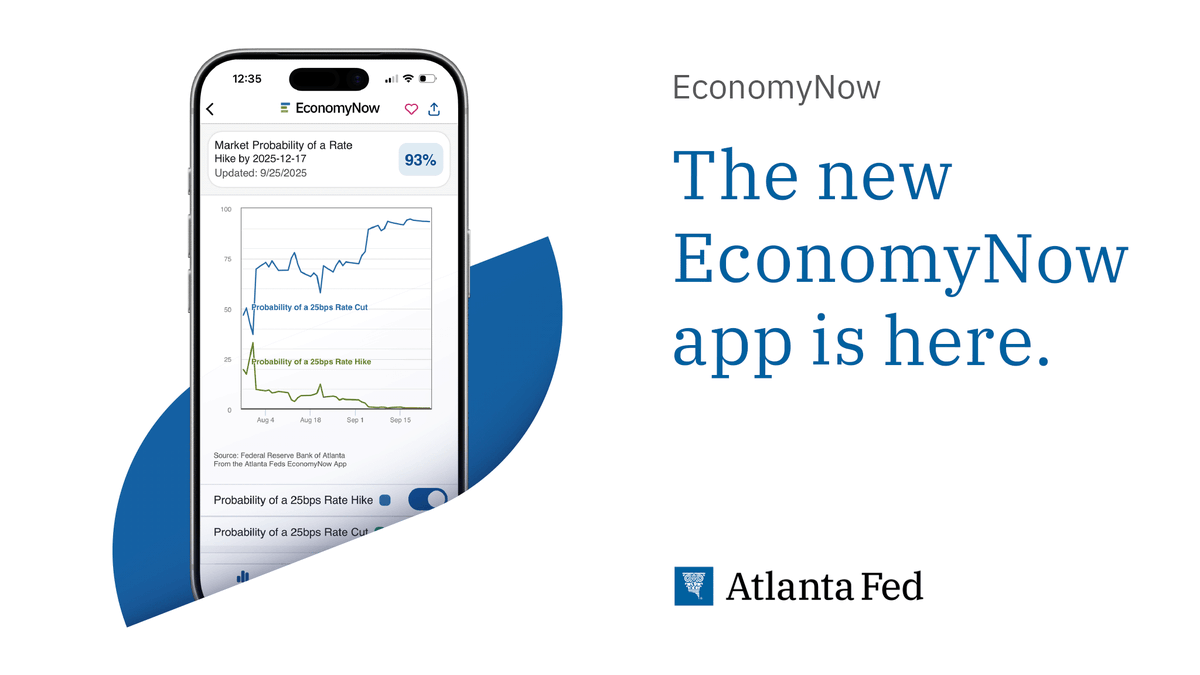
You can now favorite and share your most-used data in the Atlanta Fed’s EconomyNow app.
Download the latest version for free from the App Store for Apple devices and from Google Play for Android devices.
November 10: We’ve updated our Taylor Rule Utility data by incorporating #BLSdata in addition to updated nowcasts from the @ClevelandFed and Atlanta Fed: https://t.co/yjZ32yuaaF.
While there is a broad-based slowing among some the near-term measures of underlying CPI inflation, all the year-over-year measures on the dashboard are still elevated relative to the FOMC's price stability mandate. https://t.co/tAwUmkbJKe
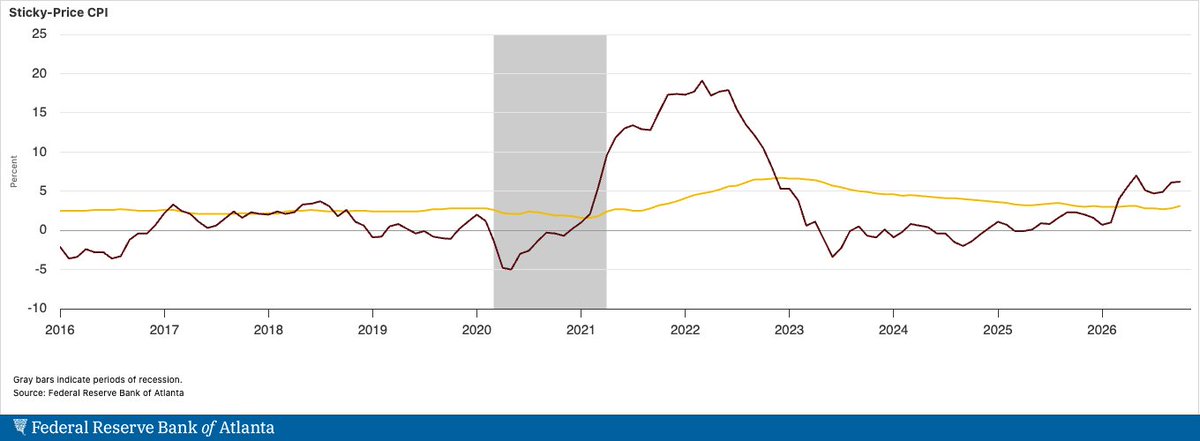
The Atlanta Fed's sticky-price consumer price index (CPI)—a weighted basket of items that change price relatively slowly—rose 4.7% (on an annualized basis) in October, following a 3.4% increase in September. On a year-over-year basis, the series is up 3.1%.
On a core basis (excluding food and energy), the sticky-price index rose 4.7% (annualized) in October, and its 12-month percent change was 3.1%.
The flexible cut of the CPI—a weighted basket of items that change price relatively frequently—Increased 3.0% (annualized) in October and on a year-over-year basis, the series is up 6.2%.
https://t.co/ZiX2HT0MXf
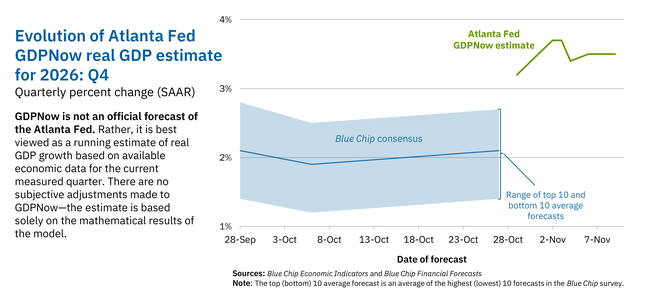
On November 9, the #GDPNow model nowcast of real GDP growth in Q4 2026 is 3.5%: https://t.co/T7FoDdgYos. #ATLFedResearch
Download our EconomyNow app or go to our website for the latest GDPNow nowcast: https://t.co/JPMzsC5TNo.
November 9: We've updated our Market Probability Tracker following @BLS_gov's release of October's #employment report. View the Atlanta Fed update online now: https://t.co/vMOS3gWwsh #ATLFedResearch
November 6: We've updated our Labor Market Sliders to reflect October data from the Bureau of Labor Statistics. Test your "what-ifs" on the Atlanta Fed website: https://t.co/3agIlm25LZ
Total nonfarm payroll employment rose by 165,000 in October, and the unemployment rate changed little at 4.1%, the @BLS_gov reported today.
https://t.co/lLJ10Atwtq
Over the past month, both initial and continuing unemployment claims held relatively steady. In the week ending October 24, seasonally adjusted initial claims totaled 195,000 nationally. Seasonally adjusted continuing claims totaled 1.7 million. Both measures remain low by historical standards, with initial claims near their lowest levels since the late 1960s. https://t.co/8BS6o4Zr7w
Quickly find and share economic data.
The updated EconomyNow mobile app allows you to favorite all your data from the Atlanta Fed.
Download the latest version for free from the App Store for Apple devices and from Google Play for Android devices.
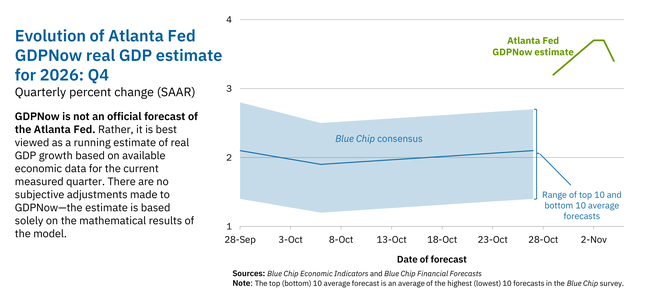
On November 4, the #GDPNow model nowcast of real GDP growth in Q4 2026 is 3.4%: https://t.co/T7FoDdgYos. #ATLFedResearch
Download our EconomyNow app or go to our website for the latest GDPNow nowcast: https://t.co/JPMzsC5TNo.
Use our interactive Home Ownership Affordability Monitor for more insights on national and local homeownership affordability trends. https://t.co/ylF8aLkBy9
Falling or stabilizing home prices are providing some relief, but elevated mortgage rates continue to keep homeownership out of reach for many households across the Sixth District.
https://t.co/vbibhDKDva
More metro highlights of the recent update to our Home Ownership Affordability Monitor (HOAM) in the thread below.
New Orleans: Affordability was flat in New Orleans from July to August as home prices in the region continued to moderate. The median home sales price dropped by 0.2% in August after declining by 1.7% in July. This decline in prices was just enough to offset the downward pressure on affordability created by rising interest rates. A household making the median income in New Orleans needed to spend 45.8% of its annual income to own the median-priced home, up slightly from 45.5% in July. Meanwhile, the affordability gap (i.e., the spread between the actual median household income in the region and income needed to afford the median-priced home, or qualified income) stood at 52.6% in August.