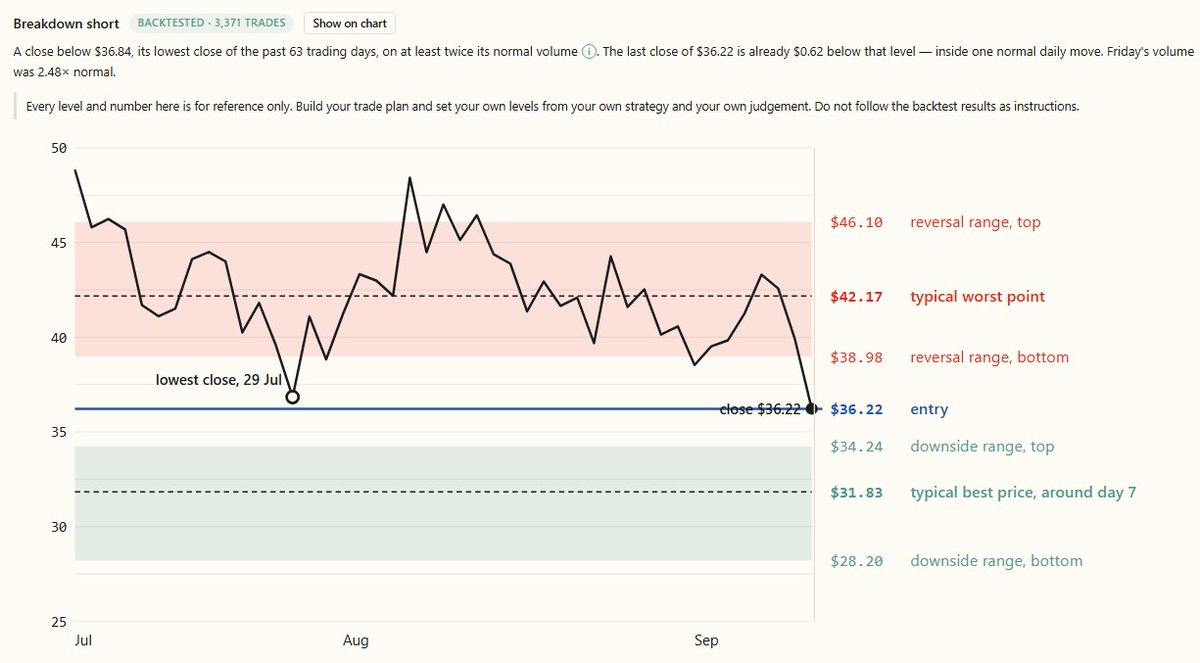
$OKLO fell 9.18% Friday and closed at $36.22, below its previous three-month closing low of $36.84, on about 2.5× its 20-day average volume.
Estimated rebound range: $38.98–$46.10
Estimated downside range: $28.20–$34.24
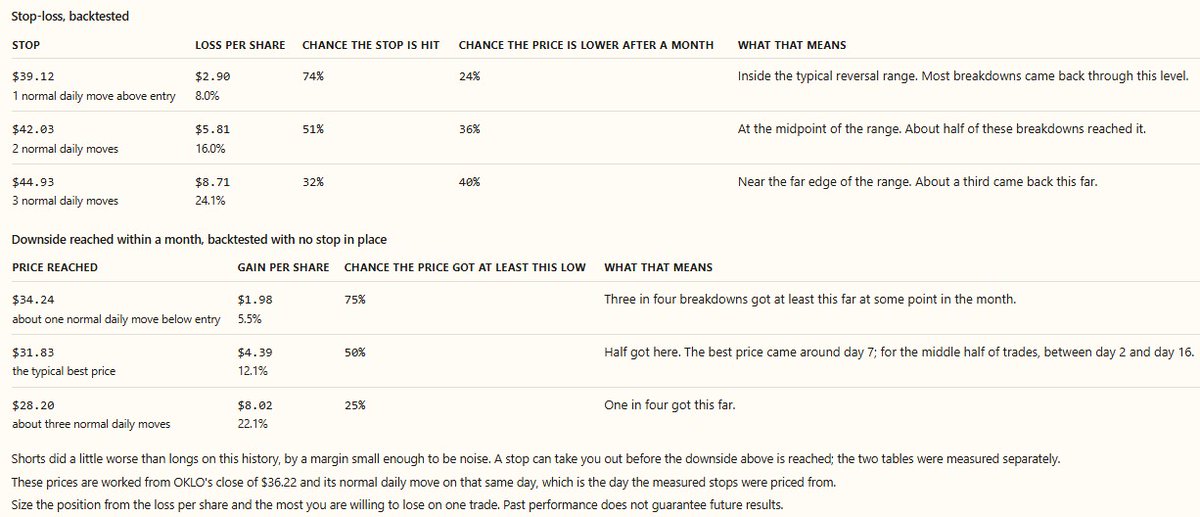
The stop-loss history shows the trade-off:
A stop at $39.12 was reached in 74% of comparable breakdowns, with $2.90 at risk per share.
A wider stop at $44.93 was reached in 32%, but increased the risk to $8.71 per share.
Atra calculated these levels from 3,371 historical breakdown trades across a broad stock universe, not from $OKLO alone.
The stop-hit rates and downside outcomes were measured separately. They are reference data, not a combined win rate or price targets.
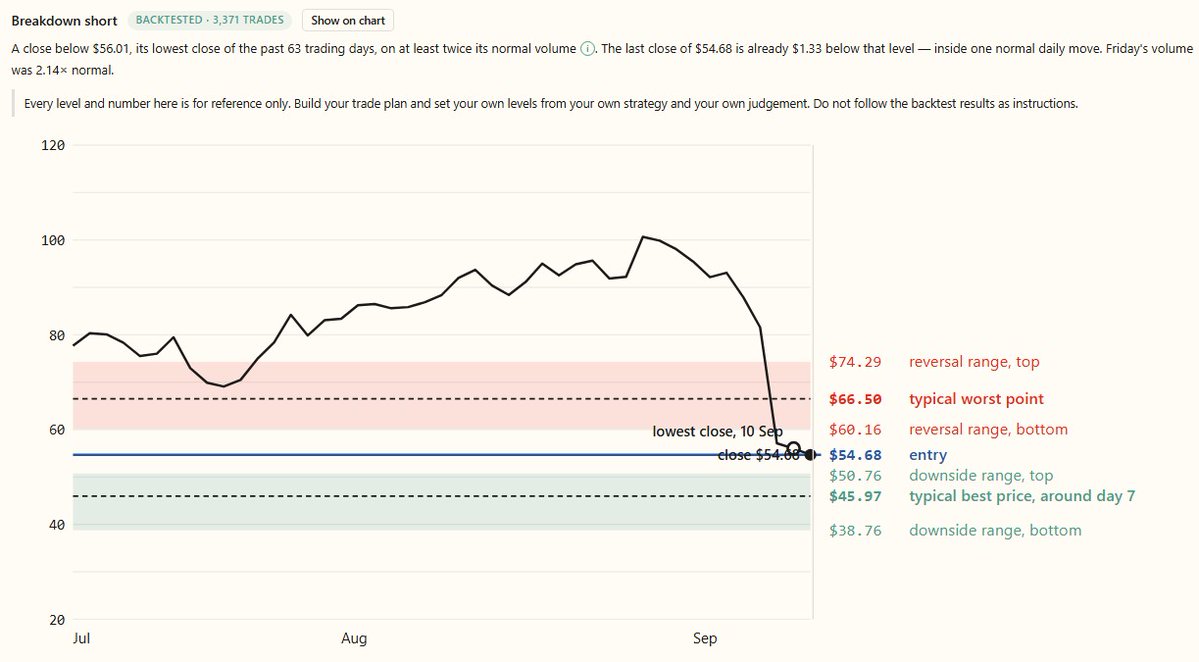
$TTAN closed at $54.68, below its three-month closing low of $56.01, on about 2.1× its 20-day average volume.
Estimated rebound range: $60.16–$74.29
Estimated downside range: $38.76–$50.76
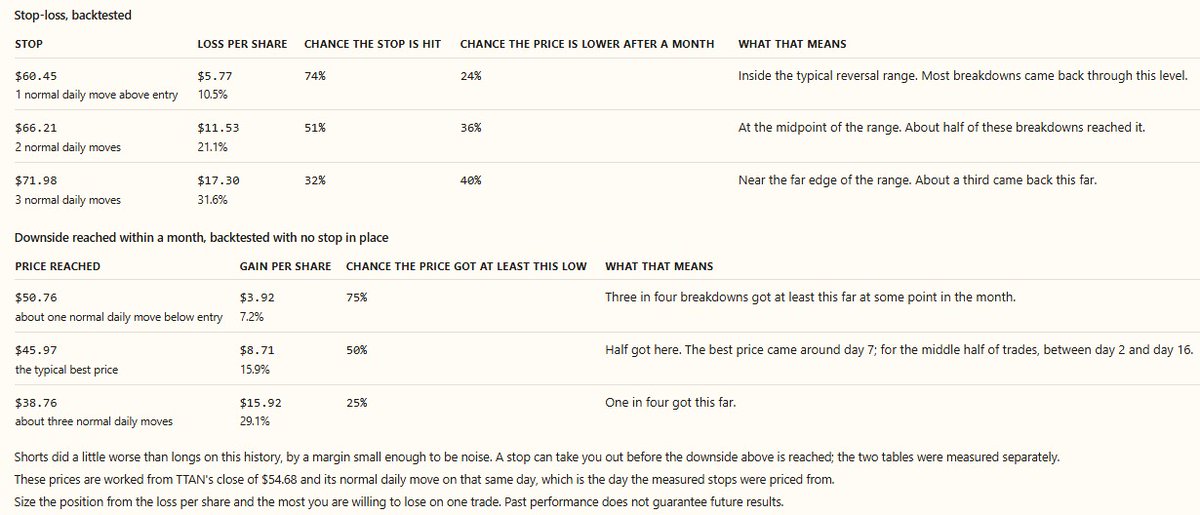
The stop-loss history shows the trade-off:
A stop at $60.45 was reached in 74% of comparable breakdowns, with $5.77 at risk per share.
A wider stop at $71.98 was reached in 32%, but increased the risk to $17.30 per share.
Atra calculated these levels from 3,371 historical breakdown trades across a broad stock universe, not from $TTAN alone.
The stop-hit rates and downside outcomes were measured separately. They are reference data, not a combined win rate or price targets.
The Fed decides on rates Wednesday. Parts of the bond market were already breaking down last week.
Thursday, 9 bond ETFs closed at three-month lows on at least 2× their 20-day average volume.
Friday, even as $SPY gained 0.85%, the short-term corporate-bond ETF $IGSB and inflation-protected Treasury ETF $VTIP made fresh high-volume three-month lows.
Higher yields generally push existing bond prices lower.
This does not predict the Fed’s decision. It shows that interest-rate pressure was already visible in bond prices and volume.
Two AI infrastructure suppliers made unusually large moves Friday.
$HPE rose 12.44% on 1.72× its 20-day average volume and closed at $62.09, 3.5% below its 52-week high; only 4 days in the past two years had a larger move.
$DELL rose 11.98% on 1.70× volume and closed at $567.29, just $0.46 below its 52-week high; only 8 days in the past two years had a larger move.
$SPY gained 0.85% Friday, but only 28.1% of the 1,000 most actively traded U.S. stocks and ETFs finished above their 20-day averages.
That improved from 21.9% Thursday, but remained below Tuesday’s 33.8%.
High-volume three-month closing lows VS. highs:
Tuesday: 8 lows VS. 1 high
Wednesday: 11 lows VS. 0 highs
Thursday: 17 lows VS. 3 highs
Friday: 7 lows VS. 2 highs
High volume means at least 2× the stock’s 20-day average volume.
Friday improved the market, but high-volume three-month lows still outnumbered highs throughout the week.
@LeifInvests First thing I’d watch is whether it can reclaim $36.84. Friday closed below it on 2.48x volume. Similar breakdowns reached $31.83 around the median.
@Gammaoptions99 Interesting! the price-based levels landed in almost the same place as your options map. I got $55.23 as nearest resistance and $60.16 as the start of the reversal range.
@painpalcapital Your $25–28 target is close to the bottom of what I found. Similar breakdowns traded into a $28.20–$34.24 range, with $31.83 around the middle.
Thinking about shorting $OKLO after Friday’s 9.18% drop? These are the two ranges to keep on your chart.
$OKLO closed at $36.22, below its previous three-month closing low of $36.84, on 2.48× its 20-day average volume.
Estimated reversal range: $39.12–$44.93
Estimated downside range: $28.20–$34.24
Atra estimated these ranges from 3,371 historical breakdown trades across a broad stock universe, not from $OKLO’s history alone. They are reference ranges, not price targets.
A quick $TTAN update after Wednesday’s 29.98% drop:
$TTAN fell another 2.37% Friday and closed at $54.68, below its three-month closing low of $56.01, on about 2.1× its 20-day average volume.
The breakdown is now confirmed.
Estimated reversal range: $60.16–$74.29
Estimated downside range: $38.76–$50.76
Atra estimated these ranges from 3,371 historical breakdown trades across a broad stock universe, not from $TTAN alone.
Three hardware stocks produced unusually large moves Friday:
$HPE rose 12.44% on 1.72× its 20-day average volume. Only 4 days in the past two years had a larger move.
$DELL rose 11.98% on 1.70× volume. Only 8 days were larger.
$HPQ rose 8.40% on 1.71× volume. Only 5 days were larger.
$SPY gained 0.85% Friday VS. a 0.58% gain for the median member of the 1,000 most actively traded U.S. stocks and ETFs.
686 advanced, 311 declined and 3 were unchanged.
Compared with Thursday:
Above the 20-day average: 22.2% to 28.1%
Above the 50-day average: 38.7% to 43.9%
Above the 200-day average: 54.5% to 56.1%
$ORCL closed Thursday at $152.94. A close above $162.52 on at least 2× its 20-day average volume would confirm Atra’s one-month breakout setup.
If confirmed:
Estimated reversal range: $138.08–$156.46
Estimated upside range: $169.36–$189.74
Atra estimated these ranges from 5,570 historical breakout trades across roughly 1,000 stocks, not from $ORCL alone.
They apply only if $ORCL closes above $162.52 on at least 2× normal volume. Until then, $162.52 is a level to watch, not a confirmed entry.
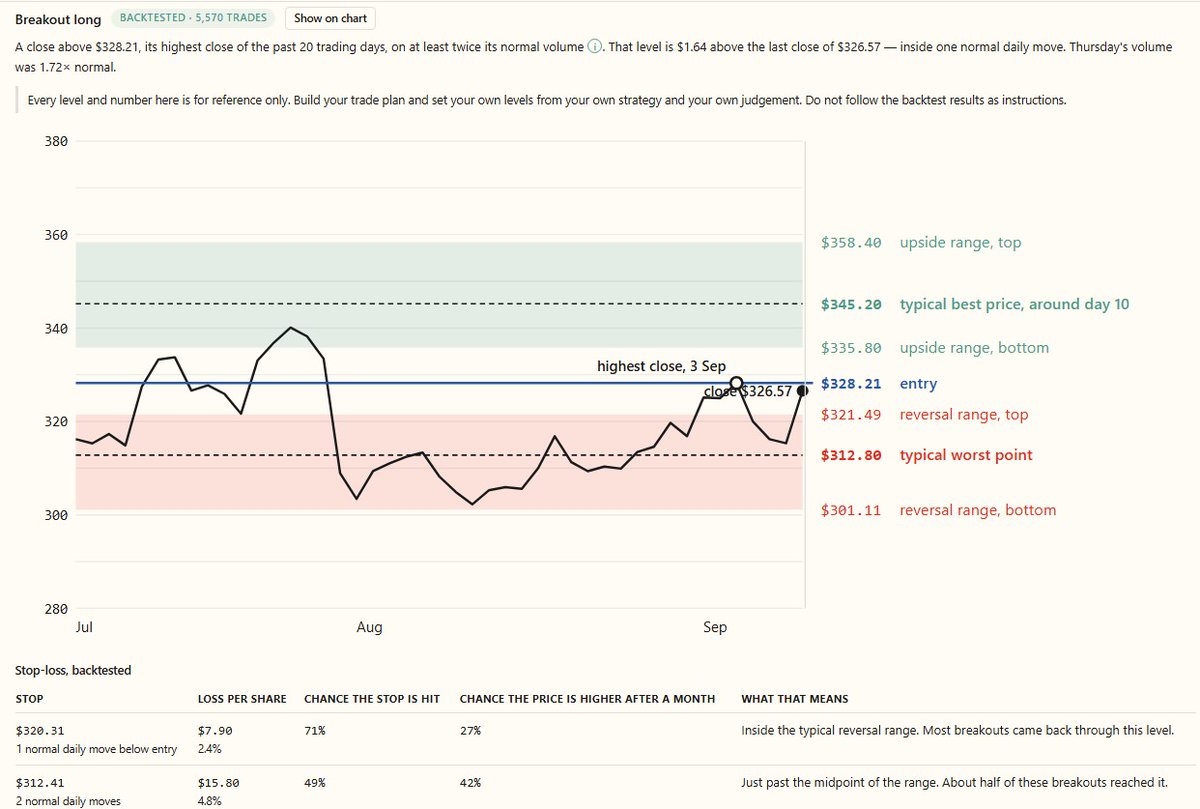
$AAPL rose 3.56% while $SPY fell 0.60% on Thursday.
The move was larger than 95% of Apple’s daily moves over the past two years and came on 1.72× its 20-day average volume
Thursday close: $326.57
Breakout level: $328.21
Atra estimated these ranges from 5,570 historical breakout trades across roughly 1,000 stocks, not from $AAPL alone.
They apply only if $AAPL closes above $328.21 on at least 2× normal volume. Until then, $328.21 is a level to watch, not a confirmed entry.
Bond prices fell Thursday as traders priced in a greater chance that interest rates could stay high or rise.
9 bond ETFs closed at three-month lows on at least 2× normal volume, including $TLT, $JNK and $MUB.
The 10-year Treasury yield climbed to roughly 4.95%. When yields rise, existing bond prices generally fall.