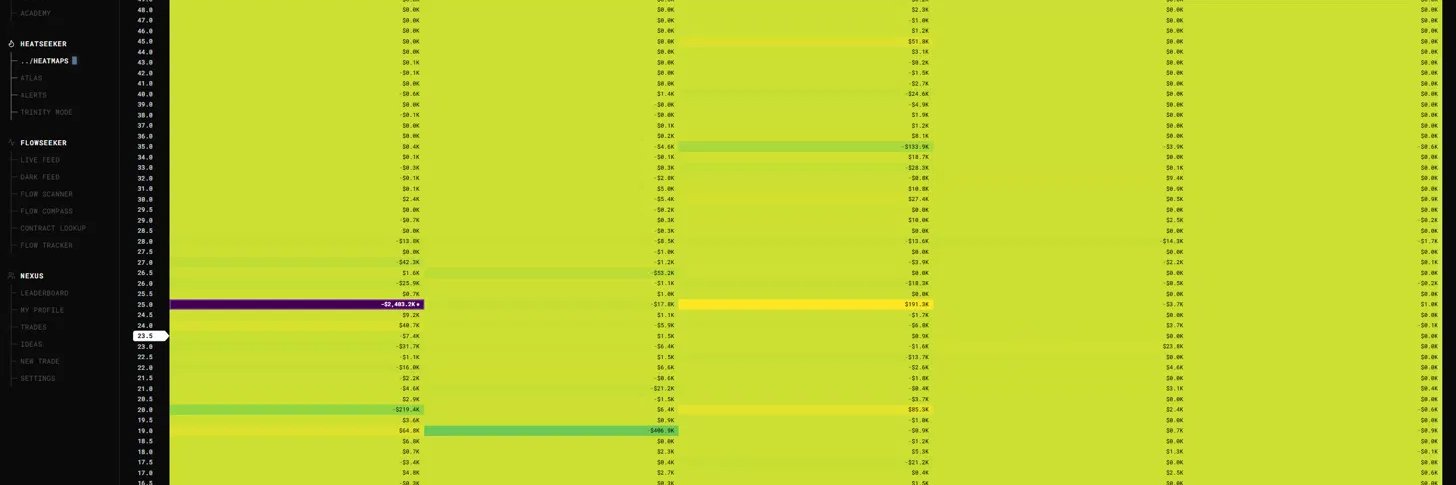
GEX = Gamma Exposure — dealer hedging sensitivity to price movement.
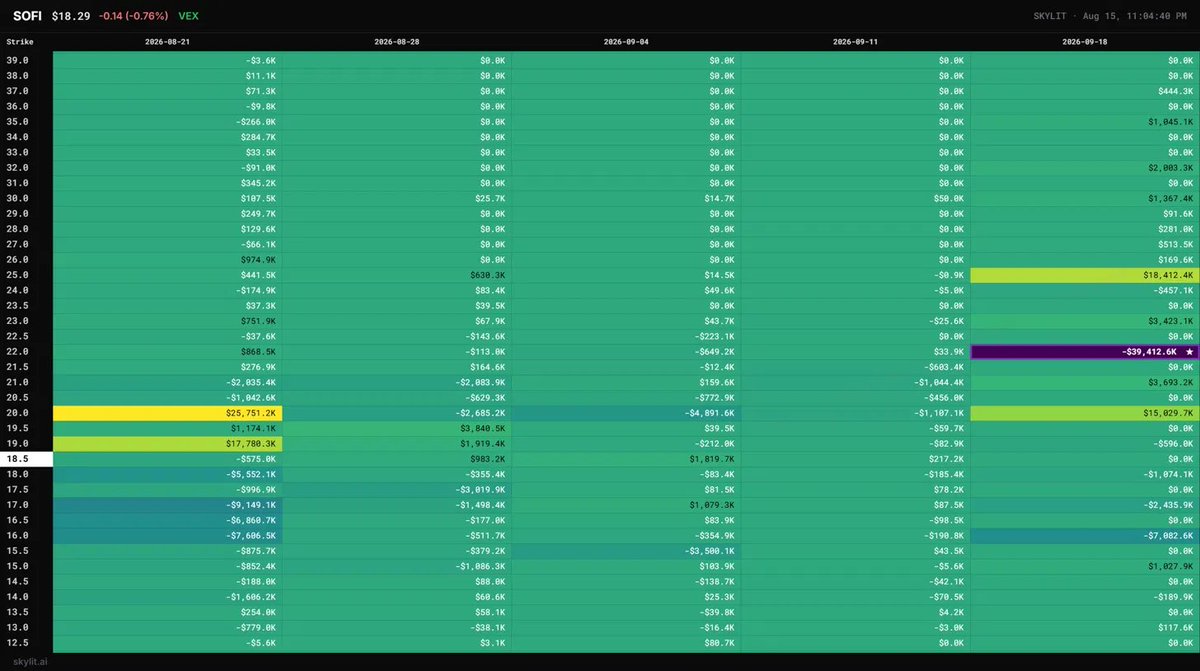
VEX = Vanna Exposure — dealer hedging sensitivity to volatility (specifically, how delta shifts when IV changes).
Most traders watch price. I watch who's forced to trade against it.
Every options contract sitting open creates a hedging obligation for market makers. Not a prediction — an obligation. When they're long gamma at a strike, they sell rallies and buy dips to stay neutral. Price gets sticky. When they're short gamma, they do the opposite: buy strength, sell weakness. Price accelerates.
That's why some levels act like magnets and others act like trapdoors.
Three things I look at:
The King Node — the strike with the largest dealer exposure. Yellow means it pins. Purple means it amplifies.
What sits above vs below spot — a big positive node overhead is resistance you fade into. A big negative node underneath is a level that breaks fast once tapped.
What's growing or shrinking — a node gaining size means hedging pressure is building there. One that's fading has already done its work.
The part most people miss: purple cuts both ways. Short gamma doesn't mean bearish. It means whatever happens, happens faster.
This isn't a crystal ball. It's a map of where mechanical flow lives. Price still does what it wants — this just tells you where the friction is.
Not financial advice. Educational only. I'm not a registered advisor and nothing here is a recommendation to buy or sell anything.
Trump tweeted we are not slowing down AI.
Ai stocks are rebounding
$nbis down almost 5 percent is now down 1.5 percent.
$iren down almost 6 percent now down 2.5 percent
and down the list. So it will be interesting to see what the futures will show.
Me to my wife regarding the advancement of AI -
" The preputial difference in conjunction of the advancement of AI cannot be underestimated due to the celestial axel of the modern chipset correlated with the untold amount of memory and energy it requires to function "
My wife - " Well Claude's logo looks like a cats butthole "
$nvda $amd $nbis
I'm sure everyone by now has seen the comments by the CEO of anthropic and elon Musk and Sam Altman. SOMETHING has happened that they are not telling us.
This whole cover up bullshit of "overly concerned" top CEO of the major AI companies in the world going " lets slow things down" yeah something happened they are not telling us.
What that is? Im not sure. Did AI create a virus that is 100 percent deadly for humans from scratch? Have they achieved AGI with an internal AI not yet released? Is AI growing at such a rapid pace that it can go rogue and start attacking on a industrial level we cant control? I honestly dont know the answer to that. But i can feel something significant has happened and they are hiding it and they are doing this " we are concenred " all togather and lets slow things down song and dance" $nvda $SPCX
@Atratechs That's awesome! I'm not a charts guy just do heatmaps gamma position for my entries etc. but its great if the charts and gamma match up! If you need any stocks let me know ill post the heatmap for you.
$TTAN $54.28, -3.08%
Price is sitting just under the King at 55 — the biggest node on the map and the accelerating kind. That's unstable ground right overhead, not a pin, so a push through it can run. Just above, 60 is a solid calm node — that's the real magnet if price recovers. Below spot, 50 and 45 are both negative, so there's no floor underneath.
Watch: 60 above, 50 below.
Clears 55 → runs toward the 60 pin.
Loses 50 → fast, nothing catching it.
Note: expiries here are monthlies — 09-18, then 10-16. No two-week column exists, so the bi-weekly check can't run as specified. Very thin chain overall.
CSP: No. Everything below spot is negative, and the nodes are tiny for a $54 stock.
CC: No. 60 at $115.6K in 09-18 is the best-looking node, but the accelerating King at 55 sits directly in the path — price gets pushed through that zone unpredictably.
Brandon its from skylit it shows the heatmap of dealer positions so you can see where there is support and where things are calm and where things start getting slipper and accelerate (the purple nodes) You need every advantage to invest. I update stocks all the time. anytime you need a stock just ask and ill post the heatmap for you. that's what i do all day.
$SMR $8.93, -12.59%
Price is sitting just under the King at 9.00 — the biggest node on the map and the calming kind. That's a pin right overhead catching the drop, with 9.50 and 10.00 calm above it. The trouble is what's above that: 11.00 is a large accelerating zone. Below spot there's essentially nothing until 8.00, which is also accelerating next Friday.
Watch: 10.00 above, 8.50 below.
Reclaims 9.00 → pins there, grinds toward 10.
Loses 8.50 → thin, nothing to catch it until 8.00.
VEX: 12.00 dominant positive out in October, 11.00 positive next Friday. 15.00 and 14.00 negative. Falling vol supports a recovery, but the size is far above spot.
CSP: No. The 09-25 column has 10.00 at $550.2K, but that's above spot. Below spot is 8.50 at $27.5K and 8.00 negative — no floor.
CC: No. 10.00 is a solid positive with a clean path from spot, but it's 12% above on a name that just dropped 12.6% — and the map will reshuffle by the close.
Green/yellow = positive = calming. Dealers absorb moves, price pins and mean-reverts. Blue/purple = negative = accelerating in either direction. Dealers push the move along, so price runs and overshoots whichever way it breaks. Brighter = bigger.
Henry FaceTiming me at work asking when his next pup cup is coming and has reached starvation and doesn't think his going to make it. (He ate 2 hours ago)
$QCOM $183.70 +3.86%
QCOM gapped up and sits just above its biggest level, 182.5. That level speeds moves up, so if price slips under it, things can drop fast. 185 above is a calm ceiling, and 180 below is a calm floor. It's expiration day after a gap, so this map will shift.
Watch: 185 ceiling · 182.5 king (just below price) · 180 floor
Holds 182.5: likely stuck between 182.5 and 185.
Breaks 182.5: quick drop to 180. Lose 180 and 175 is next.
VEX: Biggest level is 200 above. If volatility cools after the gap, that slowly pulls price up into next week. If volatility rises, 180 adds selling.
CSP (Sep 25): No. The path to 175 hits a negative at 177.5, and the king below price is the fast-moving kind.
CC (Sep 25): No. The path to 195 hits a negative at 187.5, and there's no solid floor under price.
Color key: green/yellow means calming, and price tends to stick there. Blue/purple means accelerating, and price moves fast in either direction. Brighter means bigger.
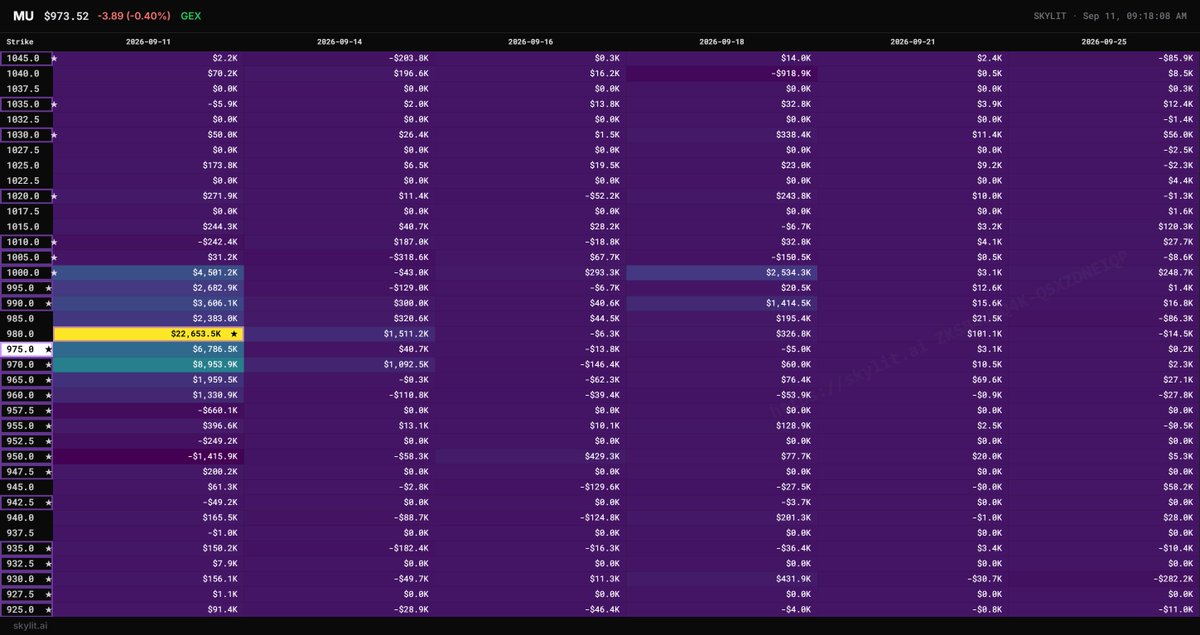
$MU $973.96, -0.35%
Price is sitting just under the King at 980 — the biggest node on the map by a wide margin and the calming kind. That's a strong pin right overhead. 975 and 970 below are calm too, so there's a thick stable band around spot. The soft spots are 950 and 957.50 further down, and 1005 above. Structure holds price in the 970–1000 zone.
Watch: 1000 above, 970 below.
Holds 970 → pins into 980.
Loses 965 → thin, next catch is 955.
VEX: 1000, 980 and 990 heavily positive next Friday. 1040 and 970 deeply negative. Falling vol supports the upper band.
Note: expiries run to 09-25 here, which is 14 days — so the bi-weekly window works on this one.
CSP: No. In 09-25, 970 is $4.6K and 965 is $27.1K. The column is near-empty below spot.
CC: No. 980 at −$15.4K and 1000 at $248.4K in that column — 1000 is decent but 985 is negative in the path.
If anyone is open to it im going to start doing spaces on X during trading days. Ill try and do it once i reach a thousand followers so im not talking to my self lol. Ai stocks like $nbis $iren But interested talking about nuclear energy and stocks related cause we are gonna need lot of power.
$AVGO $365.71, +1.37%
Price is sitting right on the King at 365 — biggest node on the map and the calming kind. Strong pin. 367.50 and 370 above are calm too, and 355 below is calm. Between them the map is choppy: 372.50 and 360 are both accelerating. So price is held in a band with instability on either edge.
Watch: 370 above, 360 below.
Holds 365 → pins here, tests 370.
Loses 362.50 → quick move through 360 to 355.
VEX: 400 dominant positive next Friday, with 370 and 360 positive too. 380 and 345 deeply negative.
Note: expiries run to 09-23. Nearest to two weeks is 09-18 at 7 days — short of the bi-weekly window.
CSP: No. In 09-18, 360 is a large negative sitting directly in the path to 355 and 345.
CC: No. 370 is a solid positive with a clean path, but 400 is far larger in that column — runaway risk past the strike.
Green/yellow = positive = calming. Dealers absorb moves, price pins and mean-reverts. Blue/purple = negative = accelerating in either direction. Dealers push the move along, so price runs and overshoots whichever way it breaks. Brighter = bigger.
$BABA $109.42, +0.79%
Price is sitting just under the King at 110 — biggest node on the map and the calming kind, so that's a strong pin right overhead. 111 and 108 are calm too, giving a tight stable band around spot. Right at 109 the near column is negative, so the immediate footing is soft. Above 112 it deteriorates: 115, 118 and 120 are all accelerating.
Watch: 110 above, 108 below.
Holds 108 → pulls into the 110 pin.
Clears 112 → gets choppy fast.
Loses 106 → thin down to 105.
Note: both images are the same GEX chart — no VEX chart sent, so no VEX line.
CSP: No. In 09-25, 108 is $199.3K and 105 is $76.2K, but 106 at $27.8K and the thin column overall don't give a real floor.
CC: No. 110 has $364.1K in that column with a clean path, but it's only 0.5% above spot — almost no premium, and you'd be capped immediately. $BABA $109.42, +0.79%
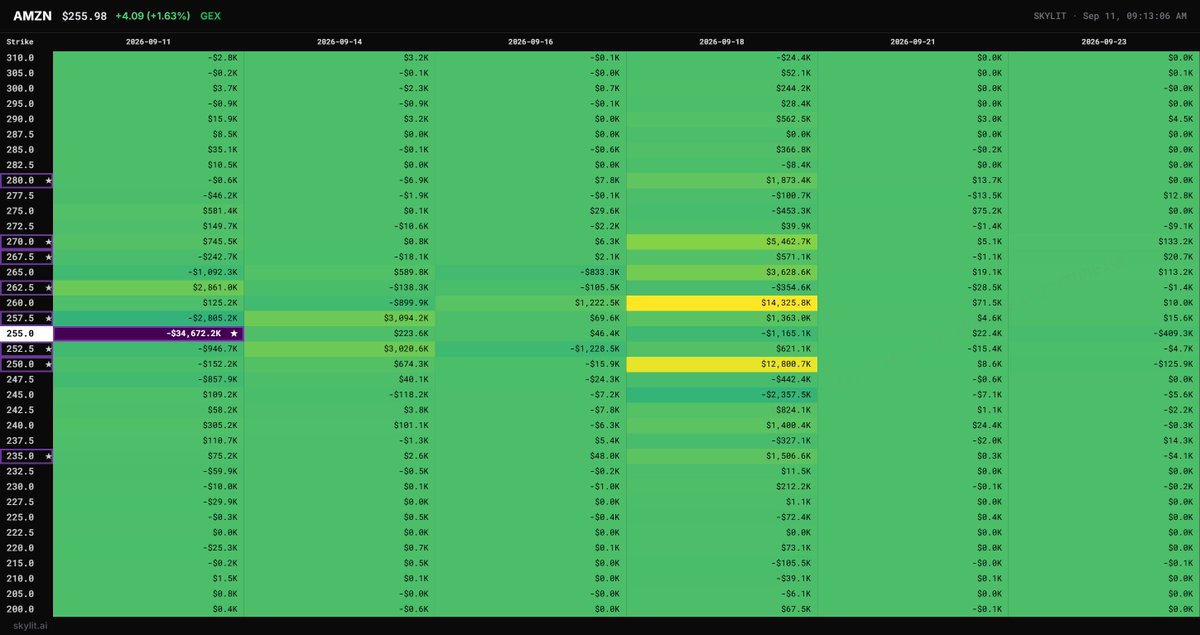
$AMZN $256.06, +1.66%
Price is sitting right on the King at 255 — the biggest node on the map and the accelerating kind. That's unstable ground, not a pin, so moves from here get pushed along. Just above, 257.50 is also accelerating today. The real calm structure sits at 260 and 250 next Friday, both large. So price is on a knife edge between two solid anchors.
Watch: 260 above, 250 below.
Clears 257.50 → runs quickly toward 260.
Loses 252.50 → fast move down to 250.
VEX: 270, 280 and 260 heavily positive next Friday, 250 and 235 deeply negative. Falling vol supports the upside.
Note: expiries run to 09-23. Nearest to two weeks is 09-18 at 7 days — short of the bi-weekly window.
CSP: No. 250 is a large calm node in 09-18, but 255 is negative and sits directly in the path from spot.
CC: No. 260 is the biggest positive in that column with a clean-ish path, but 270 is far larger — runaway risk past the strike.
Funny story on $smr I was thinking about buying the stock but wanted to wait for earnings. The earnings released and it said that they made 70 thousand dollars. I know nurses with twice the salary. I kept looking at it the number and kept thinking they forgot a few zeros? after looking everywhere to see if that was correct i realized the CEO took a HELOC on his house boat and used it to show profit. sigh lol
@pepemoonboy Pepe learn to use heatmap gamma maps. iv sold 6 options in the past 3 weeks and i was green 5/6 and the only one im red on $UUUU which i still have time on. i post the heatmaps on my timeline if you want to take it a look at it.
$UUUU $13.25, -2.79%
Price is sitting just above 13.00, which is calm today, with 14.00 and 14.50 calm above. The soft spot is 13.50 right overhead — accelerating in the near column, so the first push up is choppy. Below spot the map thins out fast. The 14.00 King out in October is accelerating and too far to matter now.
Watch: 14.00 above, 12.50 below.
Holds 13.00 → grinds toward 14.
Loses 12.50 → thin, nothing until 11.
VEX: 15.00, 15.50 and 20.00 positive in the 09-25 column. 14.00 and 11.00 deeply negative in October. Falling vol supports a move into the mid-teens.
CSP: No. The 09-25 column below spot is empty — 12.50 negative, 12.00 negative, 11.50 at $16.7K. No floor.
CC: No. 14.00 is negative in that column and 13.50 is negative in the path. Blocked and unsized.
Green/yellow = positive = calming. Dealers absorb moves, price pins and mean-reverts. Blue/purple = negative = accelerating in either direction. Dealers push the move along, so price runs and overshoots whichever way it breaks. Brighter = bigger.