We love to visualize data in creative ways.
In this monster thread we will share 25 of our most appreciated visuals. Let's dig in 🧵
1. Almost 70 years of $BRK compounding:
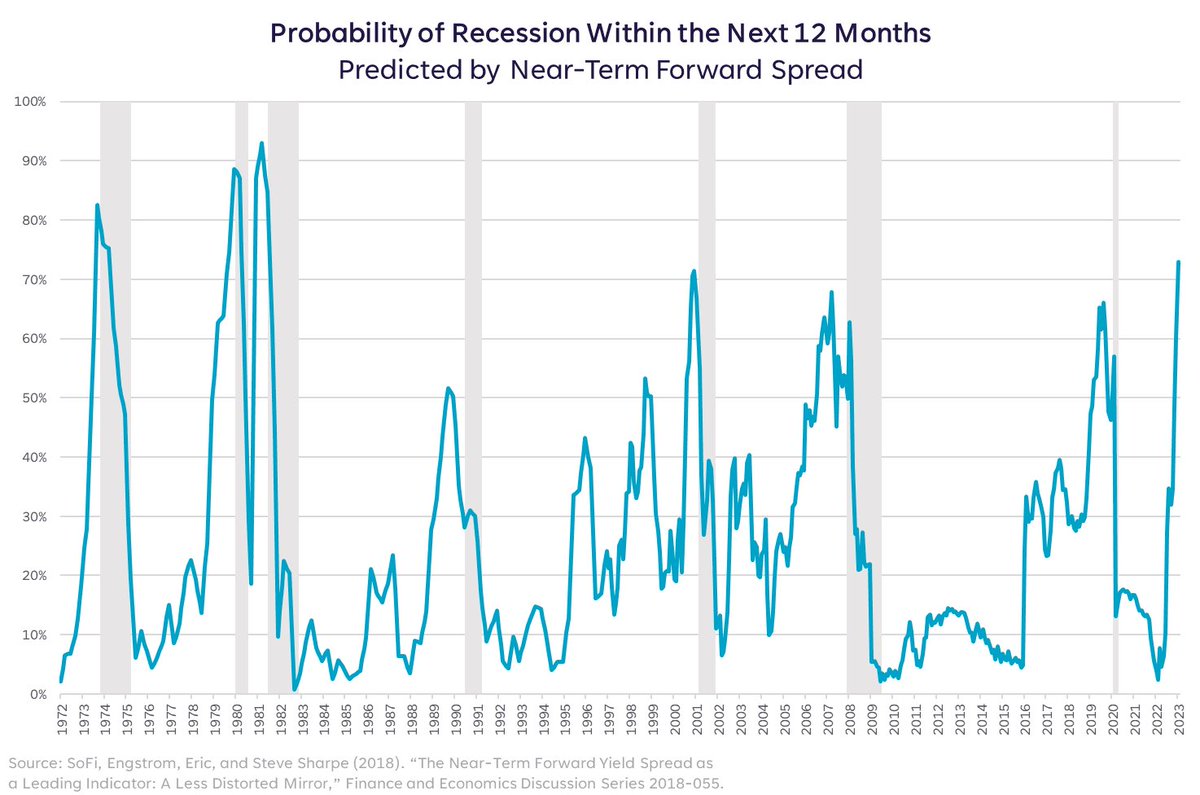
The Near-term Forward Spread is at its deepest level of inversion in over 40 years implying a 73% chance of recession within the next 12 months. Bond market still shouting at equity bulls.
Scammers are working hard to get your personal information and money!
Learn more to help you and your loved ones avoid becoming victims:
https://t.co/0b1Bgmi5T6
Minneapolis Fed President Neel Kashkari says he penciled in another 100 bps in rate rises this year, for a terminal policy rate of 5.4%
This is despite "increasing evidence" that inflation may have peaked https://t.co/RpskkLB83U
The market crash is here.
Forget profits -- Free cash flow matters now more than ever
If you're an individual investor, you MUST know how to read a CASH FLOW STATEMENT
Here's what you need to know:⤵️
Community financial institutions must prepare for the adoption of the Current Expected Credit Losses (CECL) standard. @federalreserve has developed tools to support community banks as they make this transition.
Learn more: https://t.co/cIlNIBtehM