पैसा नहीं तो इलाज नहीं? सरकारी अस्पताल ने बीमार माँ को वापस भेज दिया और माँ ने आधी रात सड़क पर ही बच्चे को जन्म दिया! ये एक परिवार नहीं, पूरे सिस्टम की शर्म है! गरीब होना अपराध नहीं है! दोषियों पर कार्रवाई हो! #न्यायचाहिए
The Master thread 🧵🧵
Best Trades of FY24
Let's dive deep into charts , entries , explanations and selling into strength,weakness.
Before you start reading, Retweet 🔄 and bookmark
as it's a chain thread and will be added every week
Reading BOOKS is now made easy in a format of KEY POINTS.
Overcome your FEAR & GREED
Unlock your True Potential
PDF format - Direct Google Drive Link
Link 1- https://t.co/a1TUcQpnVz
Link 2- https://t.co/9U9Mzq4hEU
Link 3 - https://t.co/8x950qYh3M
Like & Retweet to support
Good nos-31/7 from 5:30 to 6:30pm
HG Infra
#HGINFRA
Seasonality in the business
Q4 heavy
Rev at 1351cr vs 1105cr
PBT at 203cr vs 148cr
PAT at 150cr vs 109cr
Linc Ltd
#LINC
Seasonality in the business
Rev at 112cr vs 98cr
PBT at 10cr vs 6cr
PAT at 7.4cr vs 4.4cr
#BESTAGRO
Best agrolife
Blockbuster Q1FY24🔥
Rev at 612cr vs 464cr⬆️32%
EBITDA at 130cr vs 66cr⬆️97%
OPM 21% vs 14%
PAT at 90cr vs 40cr
#KEIIND
KEI industries
Seasonality in the business
Rev at 1790cr vs 1565cr
PBT at 163cr vs 140cr
PAT at 121cr vs 103cr
Shree Ganesh Remedies
#SGRL
Rev at 27cr vs 18cr
PBT at 6.5cr vs 3.9cr,q4 at 7.6cr
PAT at 4.8cr vs 2.9cr
On demand...!!!
Making a thread to put all the discussion at a place in one thread 🧵
If you are interested in this type of content consider following at @matters_penny
If you want to learn about multibagger penny stocks. Click here 👇🏻
https://t.co/hnQMHWGPUZ
���️ Retweet ♻️
MANY TRADERS Dream is to make
" CONSISTENT PROFITS " from Trading.
It is possible with correct TRADING KNOWLEDGE
I have combined all the FREE STRATEGIES & CONTENT shared in last few months 🔥
Master Thread 🧵
Scroll down 👇 and read fully
Like & Retweet is appreciated
Many Traders are tired of slow & reversal market.
Top Priority question in Banknifty & Nifty Traders mind
Which strategy can work best in this market ?
Here it is 👇
Rule Based Intraday Trading Strategy 🔥
No more frustration because of reversal
Click on "Show more" and read fully
Like & Retweet is appreciated
1] Low Volatile Market
Always understanding the current market type and aligning the strategy accordingly is more important.
How ?
I open timeframe like 30 min or hourly and check whether every day range shifting up/down or overlapping ( Overlapping means it is reversal market type - until no clear breakout )
Current Market type going on is Reversal Market in index.
2] I follow a simple rule:
If bulls have plan to dominate above previous day high in pushing price up they will not waste time doing sideways price action around PDH.
If bears have plan to dominate below previous day low in pushing price down they will not waste time doing sideways price action around PDL.
If bulls struggling to move price above PDH & bears struggling to move price below PDL 👇
The Hint - Price struggling to give directional move so only possible chance here is reversal.
3] Refer Chart 1
Time frame of the chart is 15 min
Price easily crossing PDH and continue to form sideways price for more than 1 hour 30 minute and still price reversing back below PDH.
Kindly check the written in the chart - Bulls struggle to give a directional move even after lot of time spending above PDH is a hint of TIRED BULLS [ Bulls are tired means who is leftover Bears - so the chance here more is reversal ]
Often Most traders forget to focus market / price action in perspective of BULLS vs BEARS { These are the two players in market if one fail other will try to take control }
All my rules is written in the chart kindly read it.
Also on Chart -3 Bulls rather than doing price action above PDH forming a low confident red candle and a immediate reversal [ TIRED BULLS ]
4] Refer Chart 2
A different scenario with GAP DOWN opening. GAP DOWN opening tells sellers are more dominating at opening.
If we look at yesterday closing is at Day's high.
Now look at the chart despite GAP DOWN opening price not even stable below PDL & no panic from yesterday bulls despite GAP DOWN [ Panic means after looking at yesterday close near high many traders would have gone for BTST BUY and looking at GAP DOWN if there was panic automatically BTST traders will hit Market sell order to exit ]
Immediate reversal from PDL gives more hint of TIRED SELLERS despite Gap Down.
All my rules is written in the chart kindly read it.
Time to think I Time to upgrade towards consistent profits.
If you find it useful kindly share with traders by LIKE & RETWEET this tweet.
Follow me @learntotrade365
Also to get Live Market updates of Banknifty/Nifty levels during live market hours by joining the free telegram channel -https://t.co/qtrc4OE7oX
I have shared my observation use it for educational & knowledge purposes.
Hello Traders - Time to change the way you trade.
Banknifty & Nifty Traders
Before joining any PAID Course - Read this Thread fully
- VWAP
- PIVOT , CPR
- TRADING STRATEGY
- PRICE ACTION TECHNIQUE
- OPTION TRADING METHOD & much more
Like & Retweet is appreciated
Scroll 👇
Are you searching for 🗝️ to profitable trading ?
Then first scroll down & read this MEGA Thread
Trading is helping many traders to earn more than 1,00,000/per month with proper trading skills and knowledge.
MEGA - ALL in ONE Trading Content & Strategies for FREE
Scroll down👇
Top Priority question in traders mind 👇
Why my STOPLOSS is getting triggered most of the time i trade ?
Technique to understand whether volume is real or Old business volume ?
Volume in Intraday Trading
Paid Content is FREE Now 🔥
Click on "Show More" and read fully
Like & Retweet is appreciated
1] Main reason for stoploss hunting.
Most retail traders have a habit of placing STOPLOSS at visual reference level like,
Below / Above - Day High & Low , VWAP , pivot etc...
Whether placing stoploss around day high/low is wrong ? NO
But most retail traders because of FOMO start chasing the price looking at candle color in HOPE to not miss the directional move without any plan or strategy end up placing stoploss at visual reference level.
Traders who chase the price or take trades looking at candle colour often get trapped by VOLUME SPIKE shown in the volume bar plotted in the candlestick chart
Refer the chart 1:
Around 10:40 a.m candle price made a new low with the bearish candle and good volume rise.
So here is the Smart Money game - Candle is wide red candle + Volume bar colour is red with volume spike - This make retail traders attract and directly take trades in hope of breakout below morning low.
But the volumes which came on the same candle is not totally volume from the sellers but it is STOPLOSS hunting volume of morning bulls [ Old Business ] as price is making new low all the morning & previous day's bulls placing SL below morning low / 5 min low [ Visual reference level ]
Check the Chart 2 to understand 721 & 174 lot of stoploss hunting has happened.
Most intraday retail traders blindly follow this rule Green Volume bar means buyers volume & Red volume bar means sellers volume. [ I don't know who has told this method ]
Volume bar below the candlestick chart shows total net volume which includes Limit & Market buy/sell orders + Stoploss orders [ One or two days before monthly expiry it even includes Rollover volume in continuous month future contract ]
Candle colour is green - Volume bar will be green [ But it doesn't mean buyers are more ]
Candle colour is red - Volume bar will be red [ But it doesn't mean sellers are more ]
Try to upgrade yourself as Market dynamics is changing so you have to be flexible in improving your trading knowledge.
In the same Chart 1 - Around 11:30 a.m CANDLE after making New day low price forming a green candle with Volume Spike.
Whether is it a real buyers volume near the low of the day ?
Retail traders see the Candle is bullish + volume spike with green volume bar just randomly hope it will be buyers volume and take bullish trade [ Also there is no support level around it]
Just see the follow up move of 40 points in banknifty taking more than 1 hour - Why despite big volume spike price unable to make a clean upmove ?
It's because most of the volume on that candle was STOPLOSS HUNTING Volume Spike when immediate new low made bulls stoploss got triggered. Check Chart 2 to understand - more than 1400 lots stoploss hunting volume on that candle.
3] Also kindly read the written on Chart 3 & Chart 4 i have shown examples of Stoploss hunting around VWAP also.
Chart 2 & 4 are from Order flow chart - Very important note this is not a promotional tweet & my suggestion is try to avoid purchasing order flow software without proper knowledge. Because the order flow chart looks fancy but without proper knowledge it can confuse your trading.
If you find this tweet useful kindly share with traders by LIKE & RETWEET this tweet.
Follow me @learntotrade365 for more trading content and strategies
Also to get Live Market updates of Banknifty/Nifty levels during live market by joining the free telegram channel - https://t.co/qtrc4OE7oX
I have shared my observation .Use it for educational & knowledge purpose only.
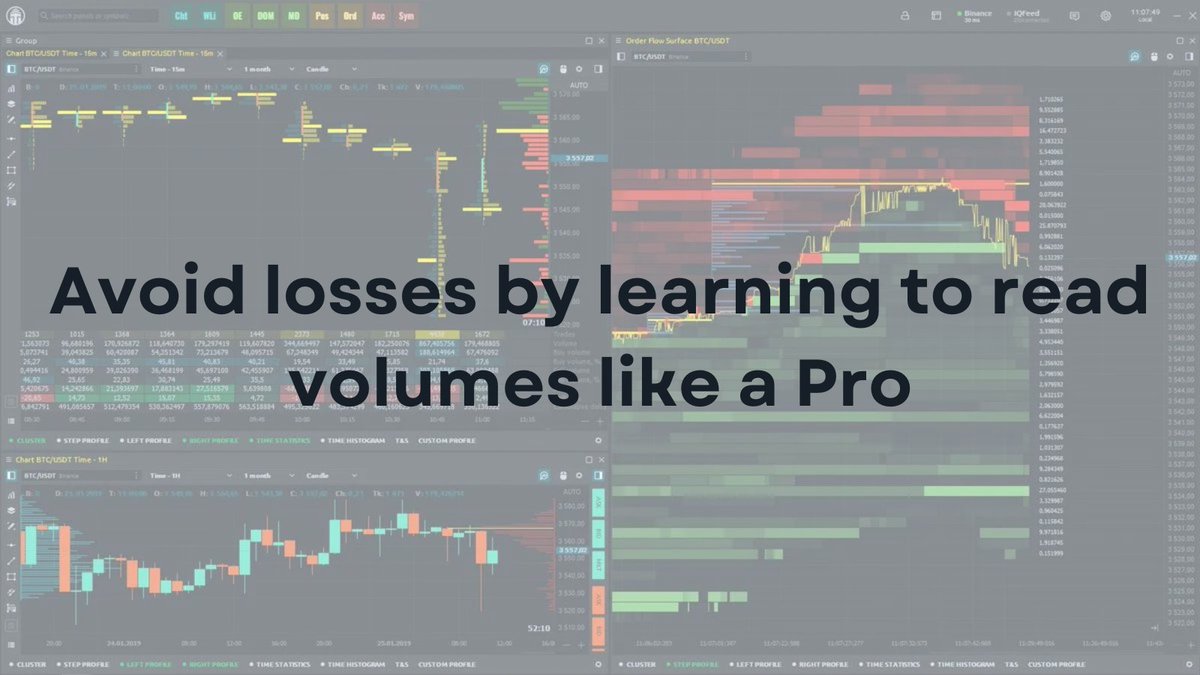
Most traders struggle with reading volumes, but you don't have to be one of them
Unlock the power of volume analysis and elevate your trading game with these 4 simple steps🔥
(1/n)
STOP searching for tools to identify Banknifty Direction.
Are you a Intraday Banknifty Trader ? then kindly spend next 5 minutes to read this tweet fully.
FREE Resource 🔥🔥 to identify Whether Banknifty will move Up or Down during live market hours.
Click on " Show more " and read fully
Like & Retweet is appreciated
1] Do you know Banknifty Distribution
percentage ?
More than 85% of Banknifty price movement is mainly depend on 6 heavy weight banks,
HDFC Bank - 27.4%
ICICI Bank - 23.6%
KOTAK Bank- 10.5%
SBI - 10.4 &
AXIS Bank - 9.5%
Indus IND Bank - 6.25%
( Percentage might slight vary depend on the recent changes )
You would have read this or watched some videos many times about the percentage . But i will share you a systematic technique to use these percentage with multi-confirmation from candlestick charts & VWAP.
VWAP is commonly used indicator by most traders for trade entry .
Now i will use VWAP slight differently along with the above percentage of banking stocks to identify INTRADAY TREND & DIRECTION.
1] Now check the [ Image No - 1 ] chart which has simple VWAP plotted on 6 Heavy Weight banking stocks to understand banknifty direction.
I follow a simple rule in a Ratio Format
[ 4:2 , 5:1 , 6:0 for Bullishness ]
- 4:2 means 4 heavy weight banks out of 6 is
above VWAP - Banknifty is Mild Bullish
- 5:1 means 5 heavy weight banks out of 6 is
above VWAP - Banknifty is Bullish
- 6:0 means 6 heavy weight banks out of 6 is
above VWAP - Banknifty is Super Bullish
Just Reverse for bearishness
[ 2:4 , 1:5 , 0:6 for Bearishness ]
- 2:4 means 2 heavy weight banks out of 6 is
above VWAP - Banknifty looks Mild Bearish.
- 1:5 means 1 heavy weight banks out of 6 is
above VWAP - Banknifty looks Bearish
- 0:6 means 0 heavy weight banks out of 6 is
above VWAP - Banknifty looks Super Bearish
In both the Bullish & Bearish if 3:3 ratio comes 3 banks above VWAP & 3 below VWAP - Sideways
----------------------------------------
2] After checking [ Image no -1 ] and above Ratio format let's move on to Image no -2.
Heavy weight stocks chart in Image - 1 on the same day price reaction of Banknifty using simple approach - Price trading around and below VWAP. I better focus to plan more bearish trades when most of the heavy weight stocks are also below VWAP.
3] Refer Image 3 & 4
Always Banknifty will not give one sided moves or staying above/below VWAP. Here an interesting example were few banks trading above VWAP & few below VWAP & 1 bank overlapping VWAP - Information is confused - Chart is warning to wait and trade as a Directional trader [ Lack of direction ]
LEARN - UPGRADE - EARN
If you find this tweet useful kindly share with traders by LIKE & RETWEET this tweet.
Follow me @learntotrade365
Also to get Live Market updates of Banknifty/Nifty levels during live market by joining the free telegram channel -https://t.co/qtrc4OE7oX
I have shared my observation .Use it for educational & knowledge purpose only.
As per the SEBI report, 89% F&O traders are not profitable.
There is a systematic method on becoming a successful trader.
Here are the 10 principles that will put you in the top 1%:
Collaborated with @AdityaTodmal 🧵





![learntotrade365's tweet photo. Many Traders are tired of slow & reversal market.
Top Priority question in Banknifty & Nifty Traders mind
Which strategy can work best in this market ?
Here it is 👇
Rule Based Intraday Trading Strategy 🔥
No more frustration because of reversal
Click on "Show more" and read fully
Like & Retweet is appreciated
1] Low Volatile Market
Always understanding the current market type and aligning the strategy accordingly is more important.
How ?
I open timeframe like 30 min or hourly and check whether every day range shifting up/down or overlapping ( Overlapping means it is reversal market type - until no clear breakout )
Current Market type going on is Reversal Market in index.
2] I follow a simple rule:
If bulls have plan to dominate above previous day high in pushing price up they will not waste time doing sideways price action around PDH.
If bears have plan to dominate below previous day low in pushing price down they will not waste time doing sideways price action around PDL.
If bulls struggling to move price above PDH & bears struggling to move price below PDL 👇
The Hint - Price struggling to give directional move so only possible chance here is reversal.
3] Refer Chart 1
Time frame of the chart is 15 min
Price easily crossing PDH and continue to form sideways price for more than 1 hour 30 minute and still price reversing back below PDH.
Kindly check the written in the chart - Bulls struggle to give a directional move even after lot of time spending above PDH is a hint of TIRED BULLS [ Bulls are tired means who is leftover Bears - so the chance here more is reversal ]
Often Most traders forget to focus market / price action in perspective of BULLS vs BEARS { These are the two players in market if one fail other will try to take control }
All my rules is written in the chart kindly read it.
Also on Chart -3 Bulls rather than doing price action above PDH forming a low confident red candle and a immediate reversal [ TIRED BULLS ]
4] Refer Chart 2
A different scenario with GAP DOWN opening. GAP DOWN opening tells sellers are more dominating at opening.
If we look at yesterday closing is at Day's high.
Now look at the chart despite GAP DOWN opening price not even stable below PDL & no panic from yesterday bulls despite GAP DOWN [ Panic means after looking at yesterday close near high many traders would have gone for BTST BUY and looking at GAP DOWN if there was panic automatically BTST traders will hit Market sell order to exit ]
Immediate reversal from PDL gives more hint of TIRED SELLERS despite Gap Down.
All my rules is written in the chart kindly read it.
Time to think I Time to upgrade towards consistent profits.
If you find it useful kindly share with traders by LIKE & RETWEET this tweet.
Follow me @learntotrade365
Also to get Live Market updates of Banknifty/Nifty levels during live market hours by joining the free telegram channel -https://t.co/qtrc4OE7oX
I have shared my observation use it for educational & knowledge purposes.](https://pbs.twimg.com/media/Fyld-uoaYAIcoXD.jpg)
![learntotrade365's tweet photo. Many Traders are tired of slow & reversal market.
Top Priority question in Banknifty & Nifty Traders mind
Which strategy can work best in this market ?
Here it is 👇
Rule Based Intraday Trading Strategy 🔥
No more frustration because of reversal
Click on "Show more" and read fully
Like & Retweet is appreciated
1] Low Volatile Market
Always understanding the current market type and aligning the strategy accordingly is more important.
How ?
I open timeframe like 30 min or hourly and check whether every day range shifting up/down or overlapping ( Overlapping means it is reversal market type - until no clear breakout )
Current Market type going on is Reversal Market in index.
2] I follow a simple rule:
If bulls have plan to dominate above previous day high in pushing price up they will not waste time doing sideways price action around PDH.
If bears have plan to dominate below previous day low in pushing price down they will not waste time doing sideways price action around PDL.
If bulls struggling to move price above PDH & bears struggling to move price below PDL 👇
The Hint - Price struggling to give directional move so only possible chance here is reversal.
3] Refer Chart 1
Time frame of the chart is 15 min
Price easily crossing PDH and continue to form sideways price for more than 1 hour 30 minute and still price reversing back below PDH.
Kindly check the written in the chart - Bulls struggle to give a directional move even after lot of time spending above PDH is a hint of TIRED BULLS [ Bulls are tired means who is leftover Bears - so the chance here more is reversal ]
Often Most traders forget to focus market / price action in perspective of BULLS vs BEARS { These are the two players in market if one fail other will try to take control }
All my rules is written in the chart kindly read it.
Also on Chart -3 Bulls rather than doing price action above PDH forming a low confident red candle and a immediate reversal [ TIRED BULLS ]
4] Refer Chart 2
A different scenario with GAP DOWN opening. GAP DOWN opening tells sellers are more dominating at opening.
If we look at yesterday closing is at Day's high.
Now look at the chart despite GAP DOWN opening price not even stable below PDL & no panic from yesterday bulls despite GAP DOWN [ Panic means after looking at yesterday close near high many traders would have gone for BTST BUY and looking at GAP DOWN if there was panic automatically BTST traders will hit Market sell order to exit ]
Immediate reversal from PDL gives more hint of TIRED SELLERS despite Gap Down.
All my rules is written in the chart kindly read it.
Time to think I Time to upgrade towards consistent profits.
If you find it useful kindly share with traders by LIKE & RETWEET this tweet.
Follow me @learntotrade365
Also to get Live Market updates of Banknifty/Nifty levels during live market hours by joining the free telegram channel -https://t.co/qtrc4OE7oX
I have shared my observation use it for educational & knowledge purposes.](https://pbs.twimg.com/media/Fyld90JaQAAYYFu.jpg)
![learntotrade365's tweet photo. Many Traders are tired of slow & reversal market.
Top Priority question in Banknifty & Nifty Traders mind
Which strategy can work best in this market ?
Here it is 👇
Rule Based Intraday Trading Strategy 🔥
No more frustration because of reversal
Click on "Show more" and read fully
Like & Retweet is appreciated
1] Low Volatile Market
Always understanding the current market type and aligning the strategy accordingly is more important.
How ?
I open timeframe like 30 min or hourly and check whether every day range shifting up/down or overlapping ( Overlapping means it is reversal market type - until no clear breakout )
Current Market type going on is Reversal Market in index.
2] I follow a simple rule:
If bulls have plan to dominate above previous day high in pushing price up they will not waste time doing sideways price action around PDH.
If bears have plan to dominate below previous day low in pushing price down they will not waste time doing sideways price action around PDL.
If bulls struggling to move price above PDH & bears struggling to move price below PDL 👇
The Hint - Price struggling to give directional move so only possible chance here is reversal.
3] Refer Chart 1
Time frame of the chart is 15 min
Price easily crossing PDH and continue to form sideways price for more than 1 hour 30 minute and still price reversing back below PDH.
Kindly check the written in the chart - Bulls struggle to give a directional move even after lot of time spending above PDH is a hint of TIRED BULLS [ Bulls are tired means who is leftover Bears - so the chance here more is reversal ]
Often Most traders forget to focus market / price action in perspective of BULLS vs BEARS { These are the two players in market if one fail other will try to take control }
All my rules is written in the chart kindly read it.
Also on Chart -3 Bulls rather than doing price action above PDH forming a low confident red candle and a immediate reversal [ TIRED BULLS ]
4] Refer Chart 2
A different scenario with GAP DOWN opening. GAP DOWN opening tells sellers are more dominating at opening.
If we look at yesterday closing is at Day's high.
Now look at the chart despite GAP DOWN opening price not even stable below PDL & no panic from yesterday bulls despite GAP DOWN [ Panic means after looking at yesterday close near high many traders would have gone for BTST BUY and looking at GAP DOWN if there was panic automatically BTST traders will hit Market sell order to exit ]
Immediate reversal from PDL gives more hint of TIRED SELLERS despite Gap Down.
All my rules is written in the chart kindly read it.
Time to think I Time to upgrade towards consistent profits.
If you find it useful kindly share with traders by LIKE & RETWEET this tweet.
Follow me @learntotrade365
Also to get Live Market updates of Banknifty/Nifty levels during live market hours by joining the free telegram channel -https://t.co/qtrc4OE7oX
I have shared my observation use it for educational & knowledge purposes.](https://pbs.twimg.com/media/Fyld8RWaQAACvoZ.jpg)

![learntotrade365's tweet photo. Top Priority question in traders mind 👇
Why my STOPLOSS is getting triggered most of the time i trade ?
Technique to understand whether volume is real or Old business volume ?
Volume in Intraday Trading
Paid Content is FREE Now 🔥
Click on "Show More" and read fully
Like & Retweet is appreciated
1] Main reason for stoploss hunting.
Most retail traders have a habit of placing STOPLOSS at visual reference level like,
Below / Above - Day High & Low , VWAP , pivot etc...
Whether placing stoploss around day high/low is wrong ? NO
But most retail traders because of FOMO start chasing the price looking at candle color in HOPE to not miss the directional move without any plan or strategy end up placing stoploss at visual reference level.
Traders who chase the price or take trades looking at candle colour often get trapped by VOLUME SPIKE shown in the volume bar plotted in the candlestick chart
Refer the chart 1:
Around 10:40 a.m candle price made a new low with the bearish candle and good volume rise.
So here is the Smart Money game - Candle is wide red candle + Volume bar colour is red with volume spike - This make retail traders attract and directly take trades in hope of breakout below morning low.
But the volumes which came on the same candle is not totally volume from the sellers but it is STOPLOSS hunting volume of morning bulls [ Old Business ] as price is making new low all the morning & previous day's bulls placing SL below morning low / 5 min low [ Visual reference level ]
Check the Chart 2 to understand 721 & 174 lot of stoploss hunting has happened.
Most intraday retail traders blindly follow this rule Green Volume bar means buyers volume & Red volume bar means sellers volume. [ I don't know who has told this method ]
Volume bar below the candlestick chart shows total net volume which includes Limit & Market buy/sell orders + Stoploss orders [ One or two days before monthly expiry it even includes Rollover volume in continuous month future contract ]
Candle colour is green - Volume bar will be green [ But it doesn't mean buyers are more ]
Candle colour is red - Volume bar will be red [ But it doesn't mean sellers are more ]
Try to upgrade yourself as Market dynamics is changing so you have to be flexible in improving your trading knowledge.
In the same Chart 1 - Around 11:30 a.m CANDLE after making New day low price forming a green candle with Volume Spike.
Whether is it a real buyers volume near the low of the day ?
Retail traders see the Candle is bullish + volume spike with green volume bar just randomly hope it will be buyers volume and take bullish trade [ Also there is no support level around it]
Just see the follow up move of 40 points in banknifty taking more than 1 hour - Why despite big volume spike price unable to make a clean upmove ?
It's because most of the volume on that candle was STOPLOSS HUNTING Volume Spike when immediate new low made bulls stoploss got triggered. Check Chart 2 to understand - more than 1400 lots stoploss hunting volume on that candle.
3] Also kindly read the written on Chart 3 & Chart 4 i have shown examples of Stoploss hunting around VWAP also.
Chart 2 & 4 are from Order flow chart - Very important note this is not a promotional tweet & my suggestion is try to avoid purchasing order flow software without proper knowledge. Because the order flow chart looks fancy but without proper knowledge it can confuse your trading.
If you find this tweet useful kindly share with traders by LIKE & RETWEET this tweet.
Follow me @learntotrade365 for more trading content and strategies
Also to get Live Market updates of Banknifty/Nifty levels during live market by joining the free telegram channel - https://t.co/qtrc4OE7oX
I have shared my observation .Use it for educational & knowledge purpose only.](https://pbs.twimg.com/media/FyBfTpzWwAEtm_S.jpg)
![learntotrade365's tweet photo. Top Priority question in traders mind 👇
Why my STOPLOSS is getting triggered most of the time i trade ?
Technique to understand whether volume is real or Old business volume ?
Volume in Intraday Trading
Paid Content is FREE Now 🔥
Click on "Show More" and read fully
Like & Retweet is appreciated
1] Main reason for stoploss hunting.
Most retail traders have a habit of placing STOPLOSS at visual reference level like,
Below / Above - Day High & Low , VWAP , pivot etc...
Whether placing stoploss around day high/low is wrong ? NO
But most retail traders because of FOMO start chasing the price looking at candle color in HOPE to not miss the directional move without any plan or strategy end up placing stoploss at visual reference level.
Traders who chase the price or take trades looking at candle colour often get trapped by VOLUME SPIKE shown in the volume bar plotted in the candlestick chart
Refer the chart 1:
Around 10:40 a.m candle price made a new low with the bearish candle and good volume rise.
So here is the Smart Money game - Candle is wide red candle + Volume bar colour is red with volume spike - This make retail traders attract and directly take trades in hope of breakout below morning low.
But the volumes which came on the same candle is not totally volume from the sellers but it is STOPLOSS hunting volume of morning bulls [ Old Business ] as price is making new low all the morning & previous day's bulls placing SL below morning low / 5 min low [ Visual reference level ]
Check the Chart 2 to understand 721 & 174 lot of stoploss hunting has happened.
Most intraday retail traders blindly follow this rule Green Volume bar means buyers volume & Red volume bar means sellers volume. [ I don't know who has told this method ]
Volume bar below the candlestick chart shows total net volume which includes Limit & Market buy/sell orders + Stoploss orders [ One or two days before monthly expiry it even includes Rollover volume in continuous month future contract ]
Candle colour is green - Volume bar will be green [ But it doesn't mean buyers are more ]
Candle colour is red - Volume bar will be red [ But it doesn't mean sellers are more ]
Try to upgrade yourself as Market dynamics is changing so you have to be flexible in improving your trading knowledge.
In the same Chart 1 - Around 11:30 a.m CANDLE after making New day low price forming a green candle with Volume Spike.
Whether is it a real buyers volume near the low of the day ?
Retail traders see the Candle is bullish + volume spike with green volume bar just randomly hope it will be buyers volume and take bullish trade [ Also there is no support level around it]
Just see the follow up move of 40 points in banknifty taking more than 1 hour - Why despite big volume spike price unable to make a clean upmove ?
It's because most of the volume on that candle was STOPLOSS HUNTING Volume Spike when immediate new low made bulls stoploss got triggered. Check Chart 2 to understand - more than 1400 lots stoploss hunting volume on that candle.
3] Also kindly read the written on Chart 3 & Chart 4 i have shown examples of Stoploss hunting around VWAP also.
Chart 2 & 4 are from Order flow chart - Very important note this is not a promotional tweet & my suggestion is try to avoid purchasing order flow software without proper knowledge. Because the order flow chart looks fancy but without proper knowledge it can confuse your trading.
If you find this tweet useful kindly share with traders by LIKE & RETWEET this tweet.
Follow me @learntotrade365 for more trading content and strategies
Also to get Live Market updates of Banknifty/Nifty levels during live market by joining the free telegram channel - https://t.co/qtrc4OE7oX
I have shared my observation .Use it for educational & knowledge purpose only.](https://pbs.twimg.com/media/FyBfSG9XoAEgSg_.png)
![learntotrade365's tweet photo. Top Priority question in traders mind 👇
Why my STOPLOSS is getting triggered most of the time i trade ?
Technique to understand whether volume is real or Old business volume ?
Volume in Intraday Trading
Paid Content is FREE Now 🔥
Click on "Show More" and read fully
Like & Retweet is appreciated
1] Main reason for stoploss hunting.
Most retail traders have a habit of placing STOPLOSS at visual reference level like,
Below / Above - Day High & Low , VWAP , pivot etc...
Whether placing stoploss around day high/low is wrong ? NO
But most retail traders because of FOMO start chasing the price looking at candle color in HOPE to not miss the directional move without any plan or strategy end up placing stoploss at visual reference level.
Traders who chase the price or take trades looking at candle colour often get trapped by VOLUME SPIKE shown in the volume bar plotted in the candlestick chart
Refer the chart 1:
Around 10:40 a.m candle price made a new low with the bearish candle and good volume rise.
So here is the Smart Money game - Candle is wide red candle + Volume bar colour is red with volume spike - This make retail traders attract and directly take trades in hope of breakout below morning low.
But the volumes which came on the same candle is not totally volume from the sellers but it is STOPLOSS hunting volume of morning bulls [ Old Business ] as price is making new low all the morning & previous day's bulls placing SL below morning low / 5 min low [ Visual reference level ]
Check the Chart 2 to understand 721 & 174 lot of stoploss hunting has happened.
Most intraday retail traders blindly follow this rule Green Volume bar means buyers volume & Red volume bar means sellers volume. [ I don't know who has told this method ]
Volume bar below the candlestick chart shows total net volume which includes Limit & Market buy/sell orders + Stoploss orders [ One or two days before monthly expiry it even includes Rollover volume in continuous month future contract ]
Candle colour is green - Volume bar will be green [ But it doesn't mean buyers are more ]
Candle colour is red - Volume bar will be red [ But it doesn't mean sellers are more ]
Try to upgrade yourself as Market dynamics is changing so you have to be flexible in improving your trading knowledge.
In the same Chart 1 - Around 11:30 a.m CANDLE after making New day low price forming a green candle with Volume Spike.
Whether is it a real buyers volume near the low of the day ?
Retail traders see the Candle is bullish + volume spike with green volume bar just randomly hope it will be buyers volume and take bullish trade [ Also there is no support level around it]
Just see the follow up move of 40 points in banknifty taking more than 1 hour - Why despite big volume spike price unable to make a clean upmove ?
It's because most of the volume on that candle was STOPLOSS HUNTING Volume Spike when immediate new low made bulls stoploss got triggered. Check Chart 2 to understand - more than 1400 lots stoploss hunting volume on that candle.
3] Also kindly read the written on Chart 3 & Chart 4 i have shown examples of Stoploss hunting around VWAP also.
Chart 2 & 4 are from Order flow chart - Very important note this is not a promotional tweet & my suggestion is try to avoid purchasing order flow software without proper knowledge. Because the order flow chart looks fancy but without proper knowledge it can confuse your trading.
If you find this tweet useful kindly share with traders by LIKE & RETWEET this tweet.
Follow me @learntotrade365 for more trading content and strategies
Also to get Live Market updates of Banknifty/Nifty levels during live market by joining the free telegram channel - https://t.co/qtrc4OE7oX
I have shared my observation .Use it for educational & knowledge purpose only.](https://pbs.twimg.com/media/FyBfPyFWcAAAV9C.jpg)

![learntotrade365's tweet photo. STOP searching for tools to identify Banknifty Direction.
Are you a Intraday Banknifty Trader ? then kindly spend next 5 minutes to read this tweet fully.
FREE Resource 🔥🔥 to identify Whether Banknifty will move Up or Down during live market hours.
Click on " Show more " and read fully
Like & Retweet is appreciated
1] Do you know Banknifty Distribution
percentage ?
More than 85% of Banknifty price movement is mainly depend on 6 heavy weight banks,
HDFC Bank - 27.4%
ICICI Bank - 23.6%
KOTAK Bank- 10.5%
SBI - 10.4 &
AXIS Bank - 9.5%
Indus IND Bank - 6.25%
( Percentage might slight vary depend on the recent changes )
You would have read this or watched some videos many times about the percentage . But i will share you a systematic technique to use these percentage with multi-confirmation from candlestick charts & VWAP.
VWAP is commonly used indicator by most traders for trade entry .
Now i will use VWAP slight differently along with the above percentage of banking stocks to identify INTRADAY TREND & DIRECTION.
1] Now check the [ Image No - 1 ] chart which has simple VWAP plotted on 6 Heavy Weight banking stocks to understand banknifty direction.
I follow a simple rule in a Ratio Format
[ 4:2 , 5:1 , 6:0 for Bullishness ]
- 4:2 means 4 heavy weight banks out of 6 is
above VWAP - Banknifty is Mild Bullish
- 5:1 means 5 heavy weight banks out of 6 is
above VWAP - Banknifty is Bullish
- 6:0 means 6 heavy weight banks out of 6 is
above VWAP - Banknifty is Super Bullish
Just Reverse for bearishness
[ 2:4 , 1:5 , 0:6 for Bearishness ]
- 2:4 means 2 heavy weight banks out of 6 is
above VWAP - Banknifty looks Mild Bearish.
- 1:5 means 1 heavy weight banks out of 6 is
above VWAP - Banknifty looks Bearish
- 0:6 means 0 heavy weight banks out of 6 is
above VWAP - Banknifty looks Super Bearish
In both the Bullish & Bearish if 3:3 ratio comes 3 banks above VWAP & 3 below VWAP - Sideways
----------------------------------------
2] After checking [ Image no -1 ] and above Ratio format let's move on to Image no -2.
Heavy weight stocks chart in Image - 1 on the same day price reaction of Banknifty using simple approach - Price trading around and below VWAP. I better focus to plan more bearish trades when most of the heavy weight stocks are also below VWAP.
3] Refer Image 3 & 4
Always Banknifty will not give one sided moves or staying above/below VWAP. Here an interesting example were few banks trading above VWAP & few below VWAP & 1 bank overlapping VWAP - Information is confused - Chart is warning to wait and trade as a Directional trader [ Lack of direction ]
LEARN - UPGRADE - EARN
If you find this tweet useful kindly share with traders by LIKE & RETWEET this tweet.
Follow me @learntotrade365
Also to get Live Market updates of Banknifty/Nifty levels during live market by joining the free telegram channel -https://t.co/qtrc4OE7oX
I have shared my observation .Use it for educational & knowledge purpose only.](https://pbs.twimg.com/media/Fv7nYQrXoAQ63u8.jpg)
![learntotrade365's tweet photo. STOP searching for tools to identify Banknifty Direction.
Are you a Intraday Banknifty Trader ? then kindly spend next 5 minutes to read this tweet fully.
FREE Resource 🔥🔥 to identify Whether Banknifty will move Up or Down during live market hours.
Click on " Show more " and read fully
Like & Retweet is appreciated
1] Do you know Banknifty Distribution
percentage ?
More than 85% of Banknifty price movement is mainly depend on 6 heavy weight banks,
HDFC Bank - 27.4%
ICICI Bank - 23.6%
KOTAK Bank- 10.5%
SBI - 10.4 &
AXIS Bank - 9.5%
Indus IND Bank - 6.25%
( Percentage might slight vary depend on the recent changes )
You would have read this or watched some videos many times about the percentage . But i will share you a systematic technique to use these percentage with multi-confirmation from candlestick charts & VWAP.
VWAP is commonly used indicator by most traders for trade entry .
Now i will use VWAP slight differently along with the above percentage of banking stocks to identify INTRADAY TREND & DIRECTION.
1] Now check the [ Image No - 1 ] chart which has simple VWAP plotted on 6 Heavy Weight banking stocks to understand banknifty direction.
I follow a simple rule in a Ratio Format
[ 4:2 , 5:1 , 6:0 for Bullishness ]
- 4:2 means 4 heavy weight banks out of 6 is
above VWAP - Banknifty is Mild Bullish
- 5:1 means 5 heavy weight banks out of 6 is
above VWAP - Banknifty is Bullish
- 6:0 means 6 heavy weight banks out of 6 is
above VWAP - Banknifty is Super Bullish
Just Reverse for bearishness
[ 2:4 , 1:5 , 0:6 for Bearishness ]
- 2:4 means 2 heavy weight banks out of 6 is
above VWAP - Banknifty looks Mild Bearish.
- 1:5 means 1 heavy weight banks out of 6 is
above VWAP - Banknifty looks Bearish
- 0:6 means 0 heavy weight banks out of 6 is
above VWAP - Banknifty looks Super Bearish
In both the Bullish & Bearish if 3:3 ratio comes 3 banks above VWAP & 3 below VWAP - Sideways
----------------------------------------
2] After checking [ Image no -1 ] and above Ratio format let's move on to Image no -2.
Heavy weight stocks chart in Image - 1 on the same day price reaction of Banknifty using simple approach - Price trading around and below VWAP. I better focus to plan more bearish trades when most of the heavy weight stocks are also below VWAP.
3] Refer Image 3 & 4
Always Banknifty will not give one sided moves or staying above/below VWAP. Here an interesting example were few banks trading above VWAP & few below VWAP & 1 bank overlapping VWAP - Information is confused - Chart is warning to wait and trade as a Directional trader [ Lack of direction ]
LEARN - UPGRADE - EARN
If you find this tweet useful kindly share with traders by LIKE & RETWEET this tweet.
Follow me @learntotrade365
Also to get Live Market updates of Banknifty/Nifty levels during live market by joining the free telegram channel -https://t.co/qtrc4OE7oX
I have shared my observation .Use it for educational & knowledge purpose only.](https://pbs.twimg.com/media/Fv7nYQqX0AIg-k4.jpg)
![learntotrade365's tweet photo. STOP searching for tools to identify Banknifty Direction.
Are you a Intraday Banknifty Trader ? then kindly spend next 5 minutes to read this tweet fully.
FREE Resource 🔥🔥 to identify Whether Banknifty will move Up or Down during live market hours.
Click on " Show more " and read fully
Like & Retweet is appreciated
1] Do you know Banknifty Distribution
percentage ?
More than 85% of Banknifty price movement is mainly depend on 6 heavy weight banks,
HDFC Bank - 27.4%
ICICI Bank - 23.6%
KOTAK Bank- 10.5%
SBI - 10.4 &
AXIS Bank - 9.5%
Indus IND Bank - 6.25%
( Percentage might slight vary depend on the recent changes )
You would have read this or watched some videos many times about the percentage . But i will share you a systematic technique to use these percentage with multi-confirmation from candlestick charts & VWAP.
VWAP is commonly used indicator by most traders for trade entry .
Now i will use VWAP slight differently along with the above percentage of banking stocks to identify INTRADAY TREND & DIRECTION.
1] Now check the [ Image No - 1 ] chart which has simple VWAP plotted on 6 Heavy Weight banking stocks to understand banknifty direction.
I follow a simple rule in a Ratio Format
[ 4:2 , 5:1 , 6:0 for Bullishness ]
- 4:2 means 4 heavy weight banks out of 6 is
above VWAP - Banknifty is Mild Bullish
- 5:1 means 5 heavy weight banks out of 6 is
above VWAP - Banknifty is Bullish
- 6:0 means 6 heavy weight banks out of 6 is
above VWAP - Banknifty is Super Bullish
Just Reverse for bearishness
[ 2:4 , 1:5 , 0:6 for Bearishness ]
- 2:4 means 2 heavy weight banks out of 6 is
above VWAP - Banknifty looks Mild Bearish.
- 1:5 means 1 heavy weight banks out of 6 is
above VWAP - Banknifty looks Bearish
- 0:6 means 0 heavy weight banks out of 6 is
above VWAP - Banknifty looks Super Bearish
In both the Bullish & Bearish if 3:3 ratio comes 3 banks above VWAP & 3 below VWAP - Sideways
----------------------------------------
2] After checking [ Image no -1 ] and above Ratio format let's move on to Image no -2.
Heavy weight stocks chart in Image - 1 on the same day price reaction of Banknifty using simple approach - Price trading around and below VWAP. I better focus to plan more bearish trades when most of the heavy weight stocks are also below VWAP.
3] Refer Image 3 & 4
Always Banknifty will not give one sided moves or staying above/below VWAP. Here an interesting example were few banks trading above VWAP & few below VWAP & 1 bank overlapping VWAP - Information is confused - Chart is warning to wait and trade as a Directional trader [ Lack of direction ]
LEARN - UPGRADE - EARN
If you find this tweet useful kindly share with traders by LIKE & RETWEET this tweet.
Follow me @learntotrade365
Also to get Live Market updates of Banknifty/Nifty levels during live market by joining the free telegram channel -https://t.co/qtrc4OE7oX
I have shared my observation .Use it for educational & knowledge purpose only.](https://pbs.twimg.com/media/Fv7nYQjWcAIu24z.jpg)





![learntotrade365's tweet photo. Many Traders are tired of slow & reversal market.
Top Priority question in Banknifty & Nifty Traders mind
Which strategy can work best in this market ?
Here it is 👇
Rule Based Intraday Trading Strategy 🔥
No more frustration because of reversal
Click on "Show more" and read fully
Like & Retweet is appreciated
1] Low Volatile Market
Always understanding the current market type and aligning the strategy accordingly is more important.
How ?
I open timeframe like 30 min or hourly and check whether every day range shifting up/down or overlapping ( Overlapping means it is reversal market type - until no clear breakout )
Current Market type going on is Reversal Market in index.
2] I follow a simple rule:
If bulls have plan to dominate above previous day high in pushing price up they will not waste time doing sideways price action around PDH.
If bears have plan to dominate below previous day low in pushing price down they will not waste time doing sideways price action around PDL.
If bulls struggling to move price above PDH & bears struggling to move price below PDL 👇
The Hint - Price struggling to give directional move so only possible chance here is reversal.
3] Refer Chart 1
Time frame of the chart is 15 min
Price easily crossing PDH and continue to form sideways price for more than 1 hour 30 minute and still price reversing back below PDH.
Kindly check the written in the chart - Bulls struggle to give a directional move even after lot of time spending above PDH is a hint of TIRED BULLS [ Bulls are tired means who is leftover Bears - so the chance here more is reversal ]
Often Most traders forget to focus market / price action in perspective of BULLS vs BEARS { These are the two players in market if one fail other will try to take control }
All my rules is written in the chart kindly read it.
Also on Chart -3 Bulls rather than doing price action above PDH forming a low confident red candle and a immediate reversal [ TIRED BULLS ]
4] Refer Chart 2
A different scenario with GAP DOWN opening. GAP DOWN opening tells sellers are more dominating at opening.
If we look at yesterday closing is at Day's high.
Now look at the chart despite GAP DOWN opening price not even stable below PDL & no panic from yesterday bulls despite GAP DOWN [ Panic means after looking at yesterday close near high many traders would have gone for BTST BUY and looking at GAP DOWN if there was panic automatically BTST traders will hit Market sell order to exit ]
Immediate reversal from PDL gives more hint of TIRED SELLERS despite Gap Down.
All my rules is written in the chart kindly read it.
Time to think I Time to upgrade towards consistent profits.
If you find it useful kindly share with traders by LIKE & RETWEET this tweet.
Follow me @learntotrade365
Also to get Live Market updates of Banknifty/Nifty levels during live market hours by joining the free telegram channel -https://t.co/qtrc4OE7oX
I have shared my observation use it for educational & knowledge purposes.](https://pbs.twimg.com/media/Fyld_lEagAAdQqU.jpg)



![learntotrade365's tweet photo. Top Priority question in traders mind 👇
Why my STOPLOSS is getting triggered most of the time i trade ?
Technique to understand whether volume is real or Old business volume ?
Volume in Intraday Trading
Paid Content is FREE Now 🔥
Click on "Show More" and read fully
Like & Retweet is appreciated
1] Main reason for stoploss hunting.
Most retail traders have a habit of placing STOPLOSS at visual reference level like,
Below / Above - Day High & Low , VWAP , pivot etc...
Whether placing stoploss around day high/low is wrong ? NO
But most retail traders because of FOMO start chasing the price looking at candle color in HOPE to not miss the directional move without any plan or strategy end up placing stoploss at visual reference level.
Traders who chase the price or take trades looking at candle colour often get trapped by VOLUME SPIKE shown in the volume bar plotted in the candlestick chart
Refer the chart 1:
Around 10:40 a.m candle price made a new low with the bearish candle and good volume rise.
So here is the Smart Money game - Candle is wide red candle + Volume bar colour is red with volume spike - This make retail traders attract and directly take trades in hope of breakout below morning low.
But the volumes which came on the same candle is not totally volume from the sellers but it is STOPLOSS hunting volume of morning bulls [ Old Business ] as price is making new low all the morning & previous day's bulls placing SL below morning low / 5 min low [ Visual reference level ]
Check the Chart 2 to understand 721 & 174 lot of stoploss hunting has happened.
Most intraday retail traders blindly follow this rule Green Volume bar means buyers volume & Red volume bar means sellers volume. [ I don't know who has told this method ]
Volume bar below the candlestick chart shows total net volume which includes Limit & Market buy/sell orders + Stoploss orders [ One or two days before monthly expiry it even includes Rollover volume in continuous month future contract ]
Candle colour is green - Volume bar will be green [ But it doesn't mean buyers are more ]
Candle colour is red - Volume bar will be red [ But it doesn't mean sellers are more ]
Try to upgrade yourself as Market dynamics is changing so you have to be flexible in improving your trading knowledge.
In the same Chart 1 - Around 11:30 a.m CANDLE after making New day low price forming a green candle with Volume Spike.
Whether is it a real buyers volume near the low of the day ?
Retail traders see the Candle is bullish + volume spike with green volume bar just randomly hope it will be buyers volume and take bullish trade [ Also there is no support level around it]
Just see the follow up move of 40 points in banknifty taking more than 1 hour - Why despite big volume spike price unable to make a clean upmove ?
It's because most of the volume on that candle was STOPLOSS HUNTING Volume Spike when immediate new low made bulls stoploss got triggered. Check Chart 2 to understand - more than 1400 lots stoploss hunting volume on that candle.
3] Also kindly read the written on Chart 3 & Chart 4 i have shown examples of Stoploss hunting around VWAP also.
Chart 2 & 4 are from Order flow chart - Very important note this is not a promotional tweet & my suggestion is try to avoid purchasing order flow software without proper knowledge. Because the order flow chart looks fancy but without proper knowledge it can confuse your trading.
If you find this tweet useful kindly share with traders by LIKE & RETWEET this tweet.
Follow me @learntotrade365 for more trading content and strategies
Also to get Live Market updates of Banknifty/Nifty levels during live market by joining the free telegram channel - https://t.co/qtrc4OE7oX
I have shared my observation .Use it for educational & knowledge purpose only.](https://pbs.twimg.com/media/FyBfViAXsAEFgfd.png)
![learntotrade365's tweet photo. STOP searching for tools to identify Banknifty Direction.
Are you a Intraday Banknifty Trader ? then kindly spend next 5 minutes to read this tweet fully.
FREE Resource 🔥🔥 to identify Whether Banknifty will move Up or Down during live market hours.
Click on " Show more " and read fully
Like & Retweet is appreciated
1] Do you know Banknifty Distribution
percentage ?
More than 85% of Banknifty price movement is mainly depend on 6 heavy weight banks,
HDFC Bank - 27.4%
ICICI Bank - 23.6%
KOTAK Bank- 10.5%
SBI - 10.4 &
AXIS Bank - 9.5%
Indus IND Bank - 6.25%
( Percentage might slight vary depend on the recent changes )
You would have read this or watched some videos many times about the percentage . But i will share you a systematic technique to use these percentage with multi-confirmation from candlestick charts & VWAP.
VWAP is commonly used indicator by most traders for trade entry .
Now i will use VWAP slight differently along with the above percentage of banking stocks to identify INTRADAY TREND & DIRECTION.
1] Now check the [ Image No - 1 ] chart which has simple VWAP plotted on 6 Heavy Weight banking stocks to understand banknifty direction.
I follow a simple rule in a Ratio Format
[ 4:2 , 5:1 , 6:0 for Bullishness ]
- 4:2 means 4 heavy weight banks out of 6 is
above VWAP - Banknifty is Mild Bullish
- 5:1 means 5 heavy weight banks out of 6 is
above VWAP - Banknifty is Bullish
- 6:0 means 6 heavy weight banks out of 6 is
above VWAP - Banknifty is Super Bullish
Just Reverse for bearishness
[ 2:4 , 1:5 , 0:6 for Bearishness ]
- 2:4 means 2 heavy weight banks out of 6 is
above VWAP - Banknifty looks Mild Bearish.
- 1:5 means 1 heavy weight banks out of 6 is
above VWAP - Banknifty looks Bearish
- 0:6 means 0 heavy weight banks out of 6 is
above VWAP - Banknifty looks Super Bearish
In both the Bullish & Bearish if 3:3 ratio comes 3 banks above VWAP & 3 below VWAP - Sideways
----------------------------------------
2] After checking [ Image no -1 ] and above Ratio format let's move on to Image no -2.
Heavy weight stocks chart in Image - 1 on the same day price reaction of Banknifty using simple approach - Price trading around and below VWAP. I better focus to plan more bearish trades when most of the heavy weight stocks are also below VWAP.
3] Refer Image 3 & 4
Always Banknifty will not give one sided moves or staying above/below VWAP. Here an interesting example were few banks trading above VWAP & few below VWAP & 1 bank overlapping VWAP - Information is confused - Chart is warning to wait and trade as a Directional trader [ Lack of direction ]
LEARN - UPGRADE - EARN
If you find this tweet useful kindly share with traders by LIKE & RETWEET this tweet.
Follow me @learntotrade365
Also to get Live Market updates of Banknifty/Nifty levels during live market by joining the free telegram channel -https://t.co/qtrc4OE7oX
I have shared my observation .Use it for educational & knowledge purpose only.](https://pbs.twimg.com/media/Fv7nYRXWAAIvfam.jpg)


