@thesunniesnft fam and all #photographers s show me your “Hometown Shots.” #Chicago#cityscape
I took this photo 12 years ago now…
Crazy to think how much has changed since then.
Happy to be here!
#sunnies state of mind
the question I get asked the most especially by other big accounts are what NFTs im buying etc as I think people know I was early to them last cycle / did well whatever
If I was v rich or had done well recently on some trades and wanted NFT exposure (besides buying BLUR)
I would sweep 50-100+ unrevealed Opepens before someone(s) else does and enter them into standout opt-ins that you like or are hyped
This is the most fundamentally important digital art set released maybe ever
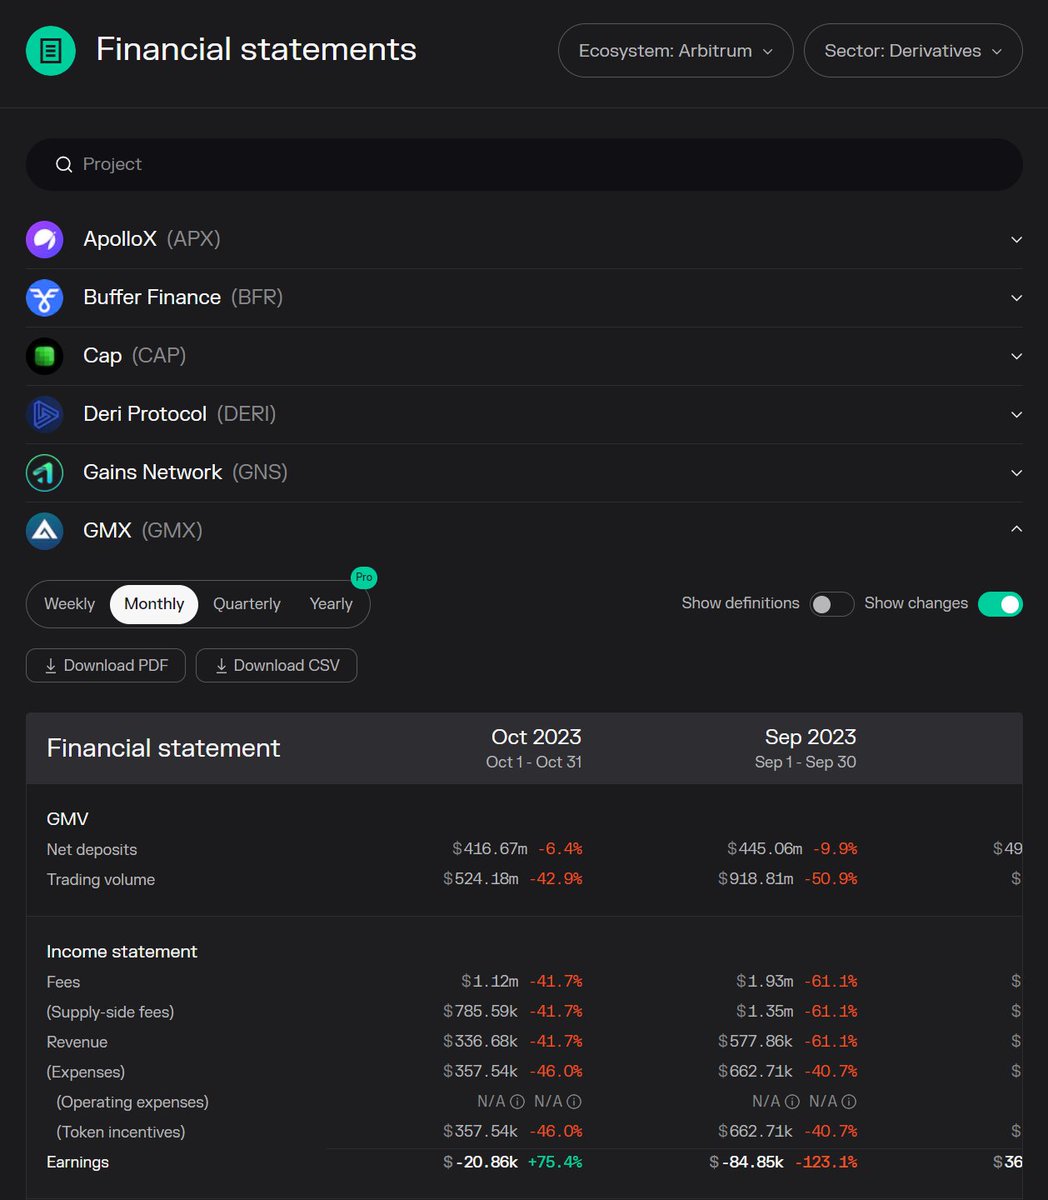
Here is a simple trick to pick cryptocurrencies for beginners:
I've tried every crypto data platform, but this simple tool makes researching way easier.
Token Terminal Financial statements
Every time I research a new token I check this dashboard & ask 3 questions:
1) How much revenue is generated?
Great protocols generate a reasonable amount of revenue compared to their marketcap.
2) Is the revenue consistent?
Great protocols generate revenue over longer time periods.
3) How many incentives are paid?
Great protocols generate high revenue with the least amount of token incentives.
Next, I calculate a score between 1-10 for each of these categories & put the numbers in a spreadsheet.
I usually compare 5-10 protocols.
Then I select the best two protocols to research them further.
I've noticed another benefit:
When using data to compare fundamentals, I'm less likely to purchase a token out of emotions.
Next time you want to buy a token because you saw someone shilling it, go to Token Terminal & check the financial statement.
Follow me @CryptoStreamHub for more content like this in the future!
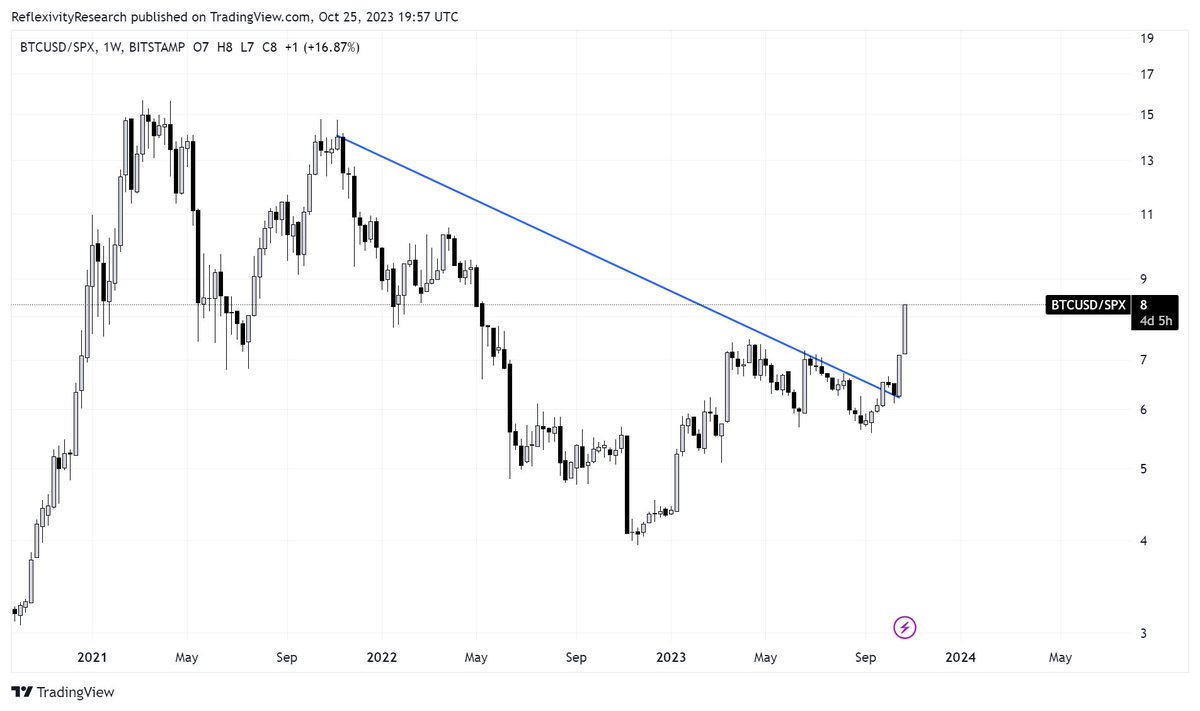
This chart will ruffle some feathers.
You'll often see charts or visuals illustrating the depreciation of the $USD over time, normalized to $1.00, of which I occasionally share myself.
However, there's an important caveat: these visuals rarely account for short-term yields. Displayed below is the purchasing power of $1, adjusting for annual CPI inflation (in red) versus the purchasing power of $1 accounting for 1-year Treasury yields less annual CPI inflation (in blue), starting from 1962
Notice anything?
The purchasing power of $1 from 1962 to the present equates to $1.85 when accounting for 1-year Treasury yields and inflation. Meanwhile, adjusting for inflation alone leaves you with just $0.10 of purchasing power.
Quite the massive difference.
However, there's more nuance to consider:
1) Let's separate the data into distinct eras,
From 1962 to start of 2009:
- Average annual inflation: 4.40%
- Average 1y yields: 6.22%
- Average difference: +1.82%
Real gains in purchasing power.
From 2009 to Present:
- Average annual inflation: 2.34%
- Average 1y yields: 1.00%
- Average difference: -1.34%
Real losses in purchasing power.
2) The data doesn't include the 1940s where financial repression massively devalued the USD to erode real debt burdens (the data I quickly threw together only went back to 1962) in the post war period.
3) Why 2009 for the change in eras? What has changed? If the U.S. can just pay a nominally higher yield than the inflation rate in perpetuity, are the fiat doomers really just delusional?
In my view:
- Positive real yields can be sustained with a clean balance sheet. It's feasible for the government to pay creditors a positive real interest rate when real debt burdens are low, demographics are booming, and the global GDP is exploding as the world industrializes.
- With Debt to GDP meaningfully > 100% and other tailwinds reversing, this is no longer the case. Post GFC and the introduction of ZIRP + QE to facilitate "growth", has the positive real yield era behind us, at least until real debt burdens have been eroded - which will take either explosive real growth, or a steady dose of inflation above yields, debasing creditors in the process.
The Bottom Line: The reality is that the average/median American individual or family often doesn't have much disposable income to capture such yields. The ones that do, benefit; and the ones that don't are the ones that pay for it.
When you look at charts showing record wealth disparity, or are wondering why the political landscape is more polarized than ever, keep this chart in mind.
Fiat inflation didn't bother the investor class from for forty years as yields outpaced inflation. Currency devaluation wasn't felt in the slightest by this cohort, they didn't just escape the devaluation, but outpaced it significantly.
Now, with Debt to GDP levels domestically and globally near record levels, expect the post 2009 dynamic to continue into the future on a longer time frame. Don't let the current tightening cycle fool you as to what must occur.
Inflation > Yields, over a sustained period of time, is the only way global governments can mask their insolvency.
Thanks for coming to my Ted Talk.
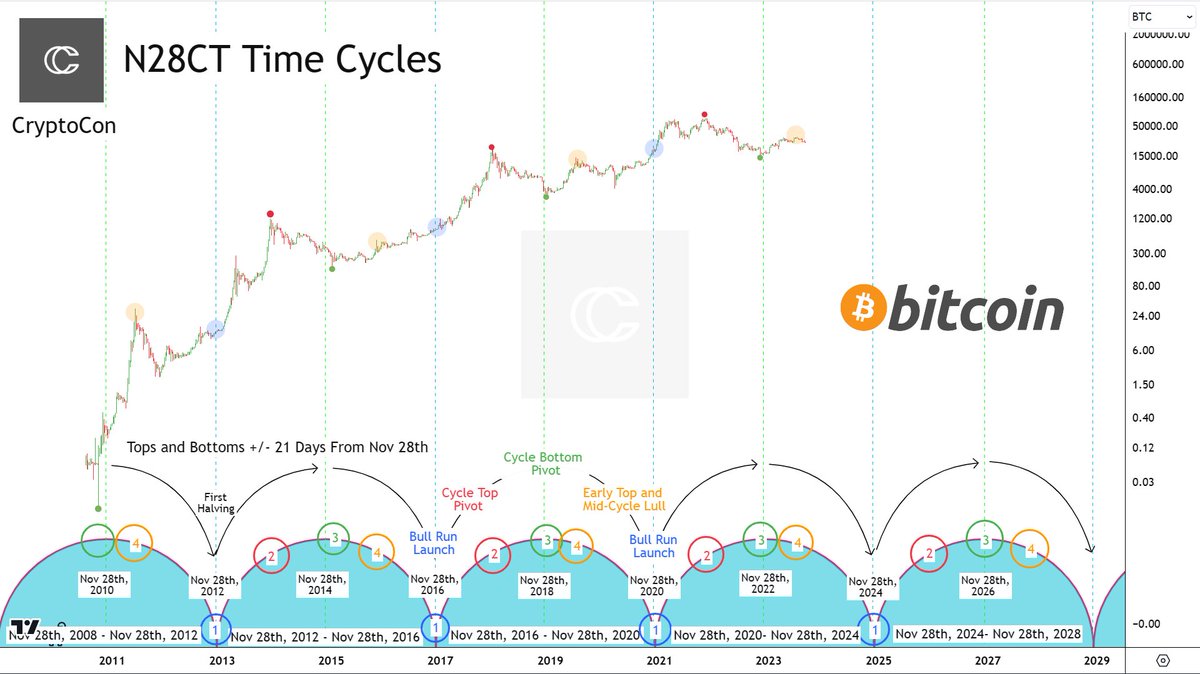
Maybe, I have finally cracked the #Bitcoin code.
The November 28th Cycles Theory has held the key.
Using 4-year time cycles against my Theory, produces Bitcoins exact behavior in time since its inception.
Cycles are centered around the date of the first halving Nov 28th.
Bitcoin price action began at the first bottom October 8th, 2010. This is where cycle curves peak, every 4 years.
Tops and bottoms come +/- 21 days from Nov 28th at their appropriate times on the curve. Tops on the upswing, bottoms on the pinnacle.
After Bitcoin bottoms, price makes an early first cycle move (orange) and enters into a mid-cycle lull.
This is the longest part of the cycle, where Bitcoin spends time around the median price (half of previous ATH), until the curve bottoms.
The bottom of the curve launches the majority of the bull run (blue circle).
The thought that everyone is expecting 4-year cycles allows them to continue right on track. Things like price and exact timing maintain surprise.
These times cycles continue to hold true to this day. We have now almost certainly put in the early top (4) and are entering the mid-cycle lull.
These take place in June in the year following the bottom. The second cycle did this in 2 years after, in June 2016.
The bull run will launch on Nov 28th, 2024.
The next top will be +/- 21 days from Nov 28th, 2025.
The next bottom will be +/- 21 days from Nov 28th, 2026.
The next mid-cycle lull: June 2027.
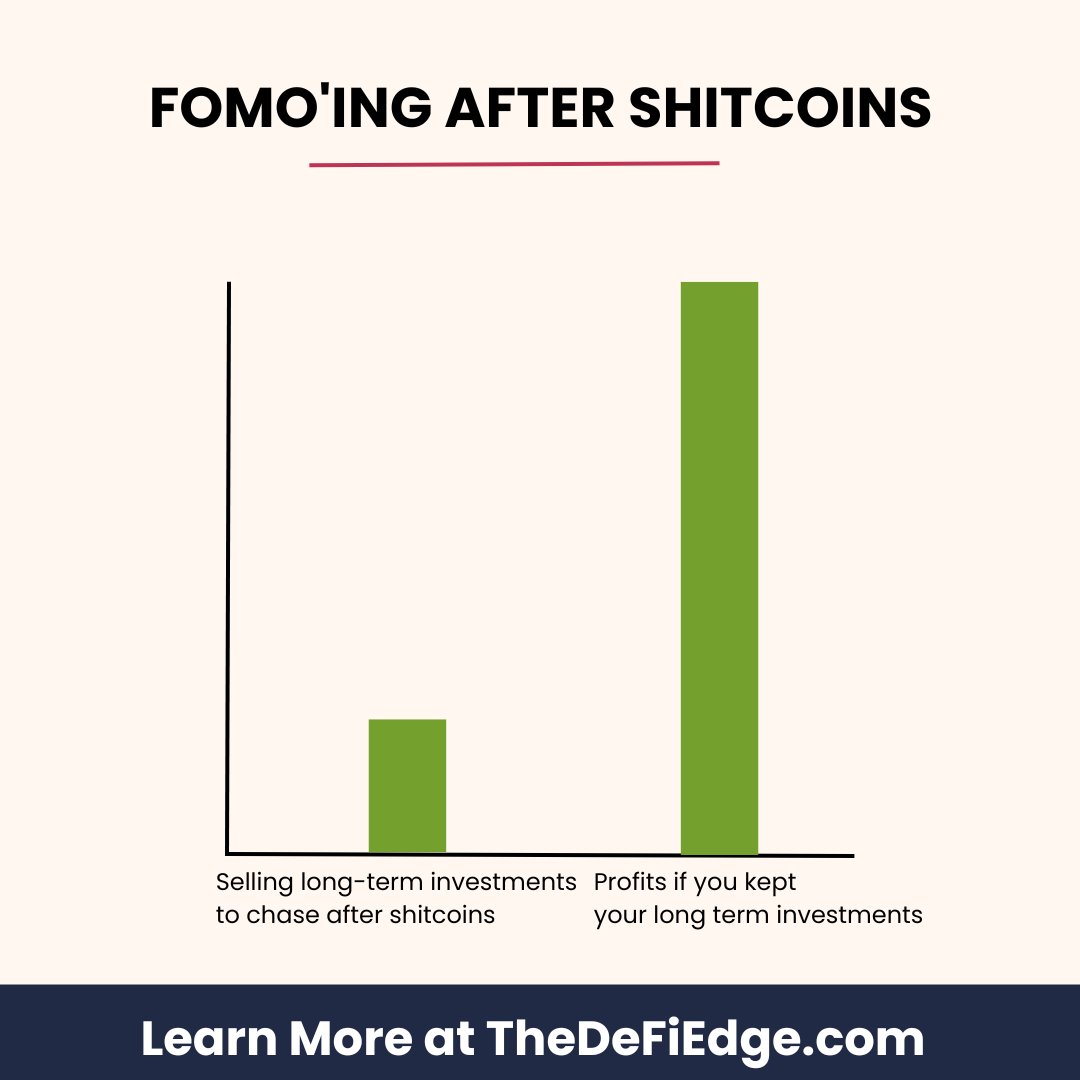
1 common bullrun mistake:
You feel FOMO, but you're out of cash. So you sell your long-term blue chips to chase after shitcoins.
"I'll buy again once I hit this 10x"
The market tanks, and the shitcoins didn't work out. You would've been better off holding & touching grass.
$MASK token is CONFIRMED, and the listing on Binance is coming soon !
They raised $700M at a valuation of $7B, so this could be one of the biggest airdrop ever
Estimed time : 5 min
Cost : 5$
Potential gain : $5000 🤑
Here is the ULTIMATE step-by-step guide 👇🧵
“Companies are more likely to die of indigestion than starvation.”
Once you get some momentum going, opportunities will start piling up.
Pursuing too many “good” opportunities robs you of the great ones.
Learn how to say no, and resist the bright shiny objects.
@CensoredMen The amount of people applauding the parents here is sickening.
Dude just wanted his parents to accept him as he is. I wish him all the best. The parents will regret that Decision when they grow even older. Sad and a huge L for the parents.
Crypto Learning Technique:
Break everything down into sub-skills.
You wouldn't learn "football" - you'd break it down and focus on sub-skills such as dribbling, shooting, and corner kicks.
This is helpful if it feels overwhelming.
Here are a few I recommend for Crypto.
Coinbase's new Layer 2 'Base' is finally here.
It's one of the most exciting crypto product launches of the year, and will be home to countless new opportunities.
🧵: Here's EVERYTHING you need to know about Base, and how you can profit as an investor. 👇
I just interviewed @0xWangarian, co-founder of Tangent Ventures with @mrjasonchoi.
Over an alpha-packed 70 minutes, we discussed:
• The top narratives to look out for
• L2s and ZK
• The best strategy for smaller traders
and more.
Here are the 13 most important takeaways.👇
Create a daily research routine and stick to it.
Doomscrolling Crypto Twitter all day is fun, but it's not the most efficient use of your time.
Here's a fun way of looking at my general workflow.
I'm a big believer in personal responsibility - especially when it comes to making financial/investment decisions.
All the best lessons I have learned about investing have come from getting absolutely rekt multiple times over many years.
In 2013, I bought my first BTC at ~$50 and then proceeded to trade away most of it chasing pump and dumps and scams. I then sold what little BTC I had left in 2014 and left crypto.
In 2017, I came back to crypto, bought my first ETH at ~$10 and rode the bull market up. My paper gains were at least 50x more money than I had ever seen in my life but did I take any profits? Nope - I rode ETH down 94% and entered 2019 absolutely rekt paper gains wise.
I credit these 2 major lessons (as well as many minor lessons over the years) with making me a much better investor and training me to avoid scams/grifts as well as have stead-fast patience as a long-term investor.
I didn't need anyone to hold my hand through all of this nor to "advise" me on what to do - I learned from my mistakes and came back stronger than ever in the 2020/2021 bull market. I took profits, bought myself some nice real life things, and then reinvested the money into ETH in 2022/23.
Now I'm positioned very nicely for the next bull market but without those many years of investing experience (or if I had outsourced my investment decisions to someone else), I'd be in a very different place - probably a much worse one.
Amazon is facing an $8B/year problem.
• ~75% of employees leave the company
• Only 1/3 of new hires stay for >90 days
• 100% employee turnover in warehouses (double the industry average)
But it gets even worse.
Let me explain: