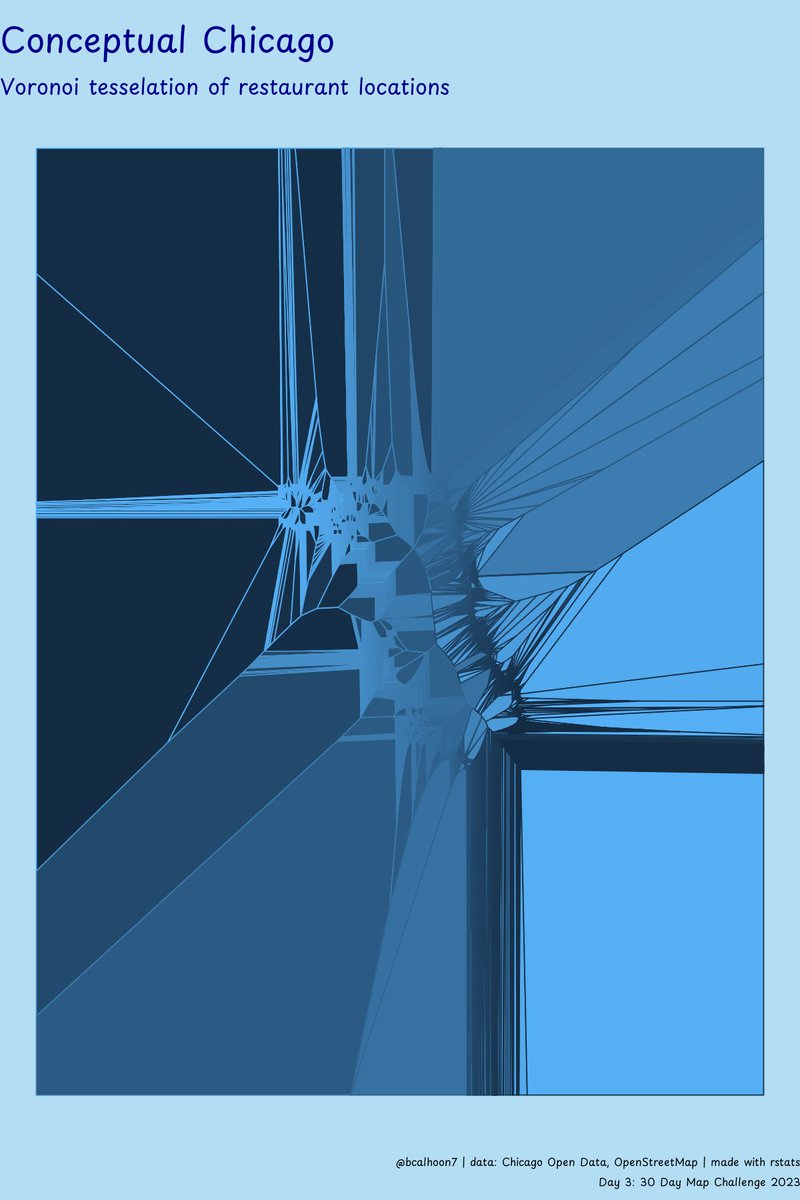
The #30DayMapChallenge is back on Nov 1! 🎉
Over 50,000 maps have been created in this challenge so far, and I can’t wait to see what everyone comes up with this year.
Check out the prompts and more details at https://t.co/aDKpnFHVyi
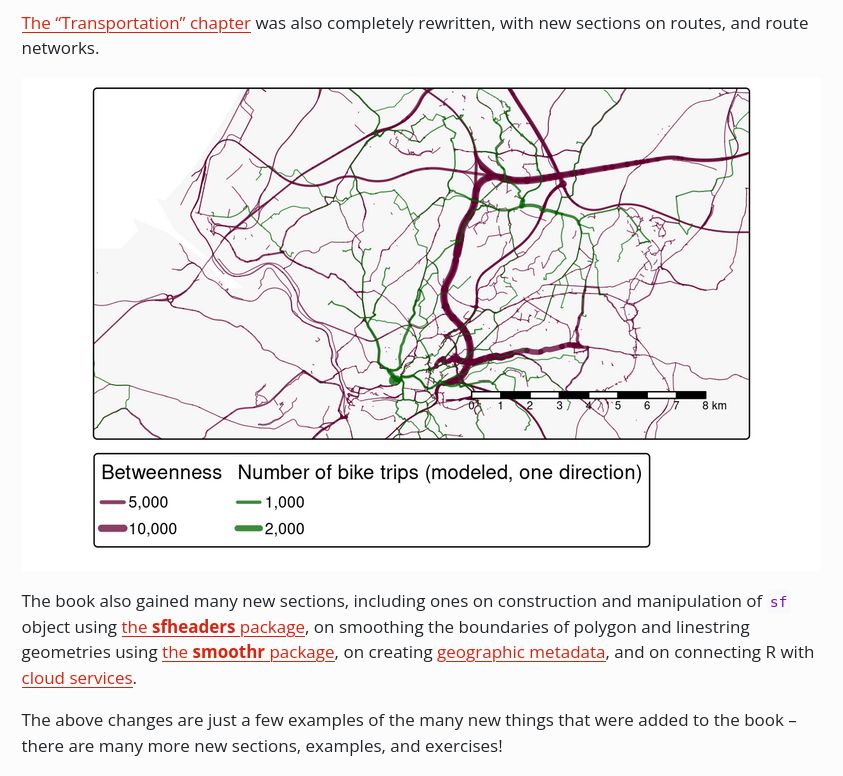
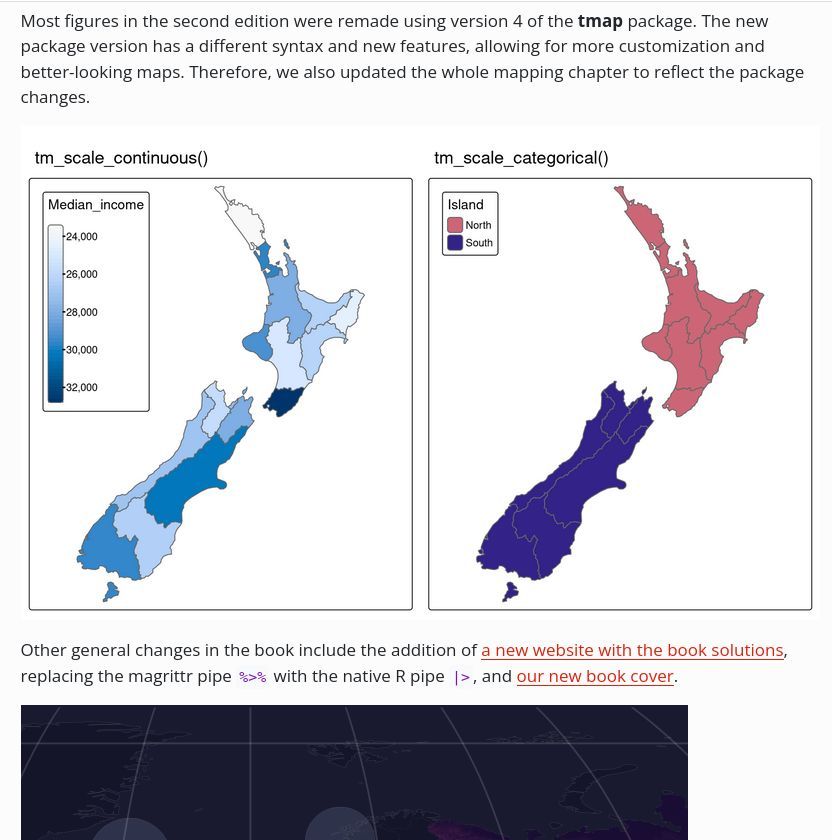
🎆 Second edition of Geocomputation with R is complete 🎆
A blog post summarizes the writing process and lists things we added and changed.
Blog post: https://t.co/VbNXx2O4qR
#rstats#rspatial#geocompx
🎆 I wrote a short paper inventorying existing methods for comparing spatial patterns in raster data and listing their #rstats implementations 🎆
Read it at https://t.co/1vUKM2OQsG
Check examples at https://t.co/Brk3OtwJYd
#spatialpatterns#gischat#rspatial
Introducing {mapgl}, an #rstats package to help you make stunning WebGL maps with @Mapbox and @maplibre!
Check out the docs here: https://t.co/VH00hOOrMc
And read through this thread for a tour of the package's features:
Looking to try something new in 2024? Check out this #rstats + #rayshader tutorial. 👇
This was my first video tutorial, posted in December 2022. Since then it has over 18k views and continues to get consistent traffic from coders worldwide!
https://t.co/1j7qVkvgqn
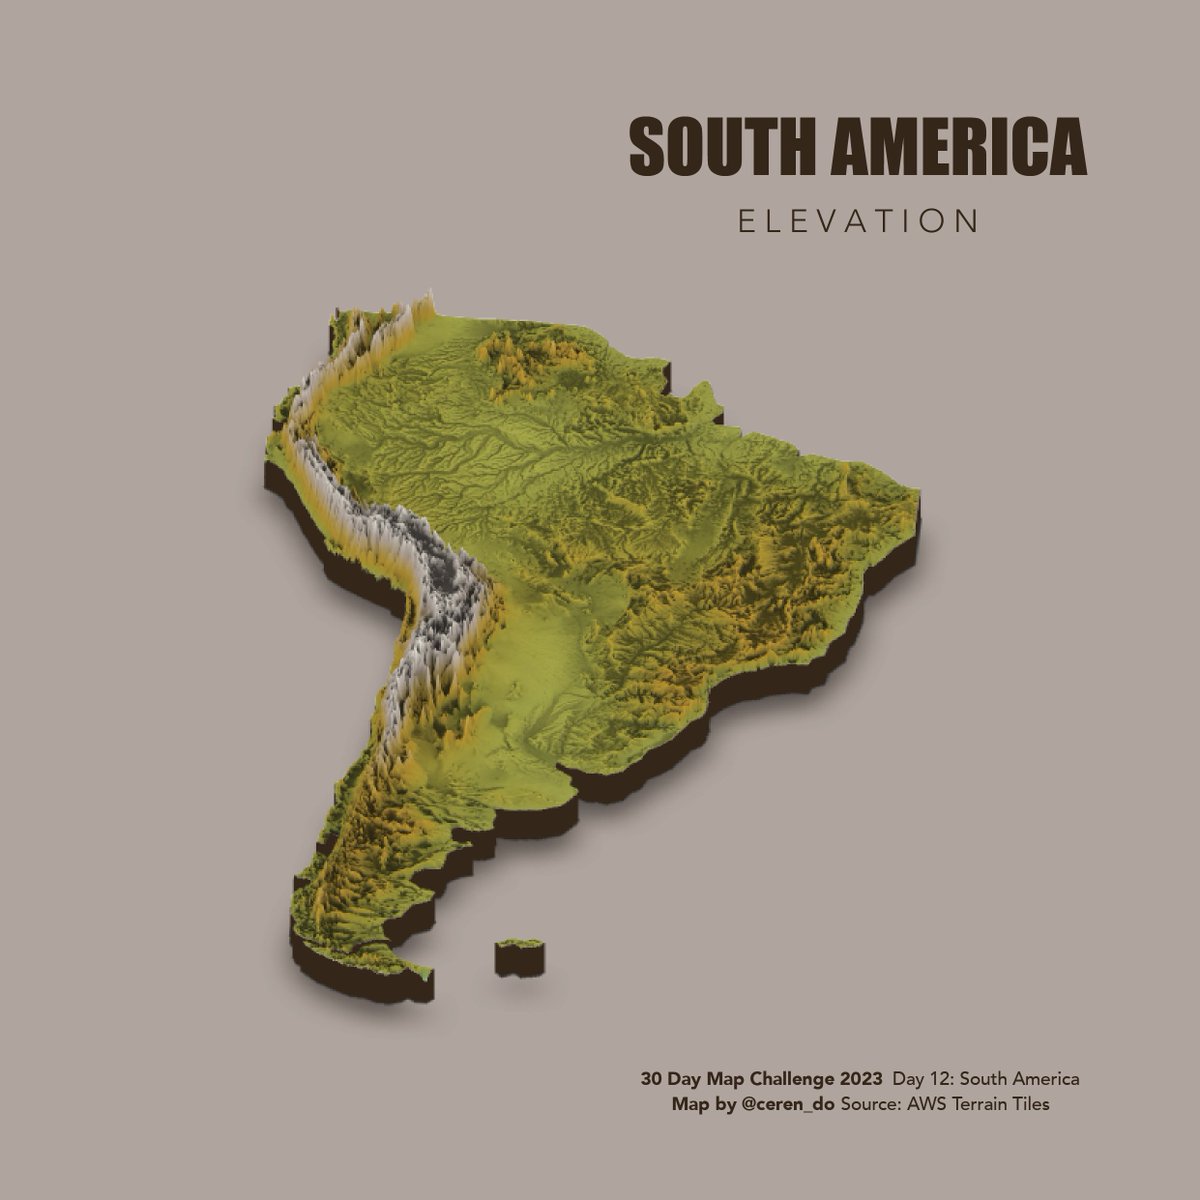
#30DayMapChallenge Day 12: South America
I have been longingly looking at all of the rayshader maps since last year's challenge and this year I built up the courage to give it a go myself🌄
📢🚨 NEW PROJECT ANNOUNCEMENT 🚨📢
I will research and create my next book with the help of AI. And I will complete the project in 30 days of work.
The book, Who Makes the NBA?, will delve deep into the stats of what it takes to reach the NBA. 📊🏀
It will also serve as a demonstration of how AI can revolutionize the creative process.
I will make use of:
- Advanced Data Analysis for data analysis and graphs (the biggest gamechanger);
- ChatGPT for targeted writing assistance and editing;
- and Midjourney for all the art.
The book will be published on December 8, 2023.
I will share the process here, with tweet threads on what I am learning -- about both the NBA and AI.
The book can be preordered here: https://t.co/x8wuoJXoyX
Day 8 of the #30DayMapChallenge - Africa. Maps show the urban extent of Lagos, Kinshasa and Cairo over time.
Code: https://t.co/1qhykMDmw1
Full Image: https://t.co/ZDAtSoroFP
#rstats#dataviz#tidyverse
#30DayMapChallenge Day 7 - Navigation. In keeping with the midwest theme, here's a map of Great Lakes shipping routes using 2021 data from #NOAA's marine cadastre. Chicago restaurants likely get great food from these routes. #rstats
code available here, https://t.co/OdIcguNaAw
I use #rstats to do #GIS every day because it is such a powerful connector of different tools and resources.
Read this 🧵 for a step-by-step workflow of how to do GIS operations with this made-up table of customer locations in R:
🆕New video tutorial on reading multiple files into R!
This is just a sneak peek or first draft. I'm eager to hear your feedback and suggestions.
https://t.co/m4e6MfnOt8
#rstats#tidyverse