Retired professional. 40+ yrs trading stocks/bonds/commodities. There are old pilots and bold pilots, but no old, bold pilots. No advice-ideas that interest me
"In the world of business, bad news often surfaces serially: You see a cockroach in your kitchen; as the days go by, you meet his relatives." - Warren Buffett
Cockroach Theory: There's never just one cockroach-the premise that when a company reveals bad news, more is yet to come
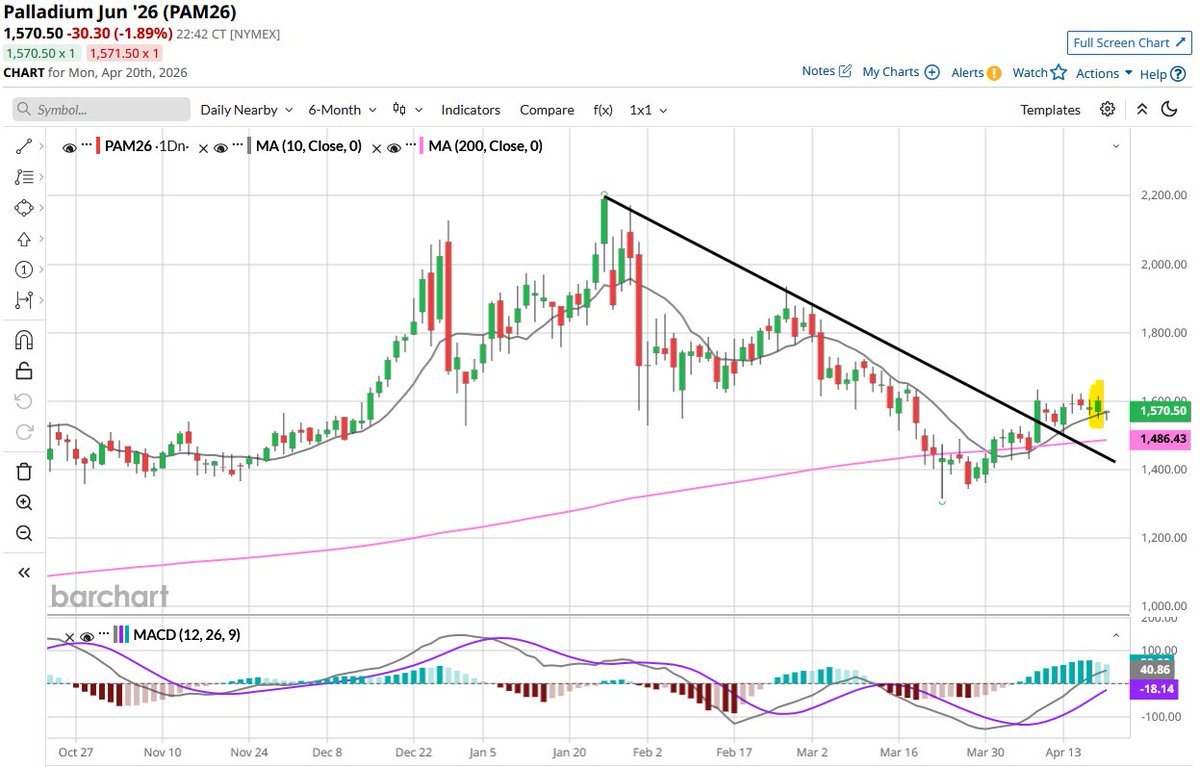
#Palladium continues higher after breaking out of the downtrend and has formed a bullish engulfing candlestick on the daily chart. Sideways/up short term.
$PALL #PA_F#Metals#Futures#Commodities
#Palladium broke out of downtrend last week. It has pulled back to test the downtrend line and 10-day moving average. It is forming a bullish engulfing candlestick on the daily chart. Sideways/up short term. Caveat--day isn't over yet. $PALL #PA_F#Metals#Futures#Commodities
#Platinum continues to trade higher after breaking out of the declining wedge pattern. It formed a bullish engulfing candlestick on the daily chart and continues trading above the 10-day MA. Sideways/up short term. $Platinum $PPLT #PL_F#Metals#Futures#Commodities
#Platinum contract is breaking out of the declining wedge pattern on the daily chart. Counts to around $3,000. Caveat--day isn't over yet. $Platinum $PPLT #Metals#Futures#Commodities
#Palladium broke out of downtrend last week. It has pulled back to test the downtrend line and 10-day moving average. It is forming a bullish engulfing candlestick on the daily chart. Sideways/up short term. Caveat--day isn't over yet. $PALL #PA_F#Metals#Futures#Commodities
#Platinum contract is breaking out of the declining wedge pattern on the daily chart. Counts to around $3,000. Caveat--day isn't over yet. $Platinum $PPLT #Metals#Futures#Commodities
#Platinum contract has bounced off of the 200 day moving average and is now threatening to break out of a potentially bullish declining wedge pattern on the daily chart. Could get interesting! $Platinum $PPLT #PL_F#Metals#Futures#Commodities
#Platinum contract has bounced off of the 200 day moving average and is now threatening to break out of a potentially bullish declining wedge pattern on the daily chart. Could get interesting! $Platinum $PPLT #PL_F#Metals#Futures#Commodities
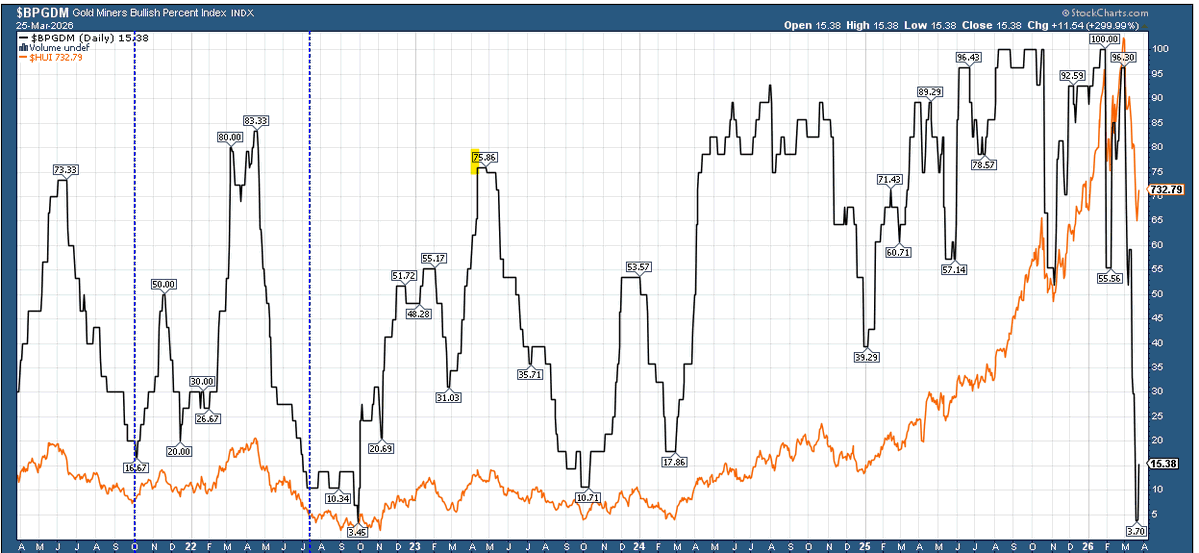
The Gold Miners Bullish Percent Index(black line) recently hit a low of 3.45%--% of stocks that had point-and-figure buys. Last time $BPGDM was this low was fall of 2022 right before a rally started in $HUI (orange line). Time for a bounce? $GDX $HUI $GLD #GC_F
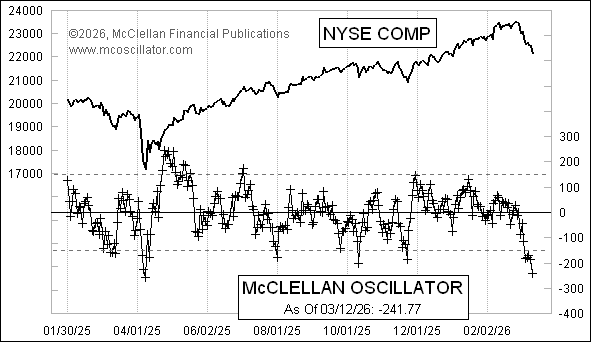
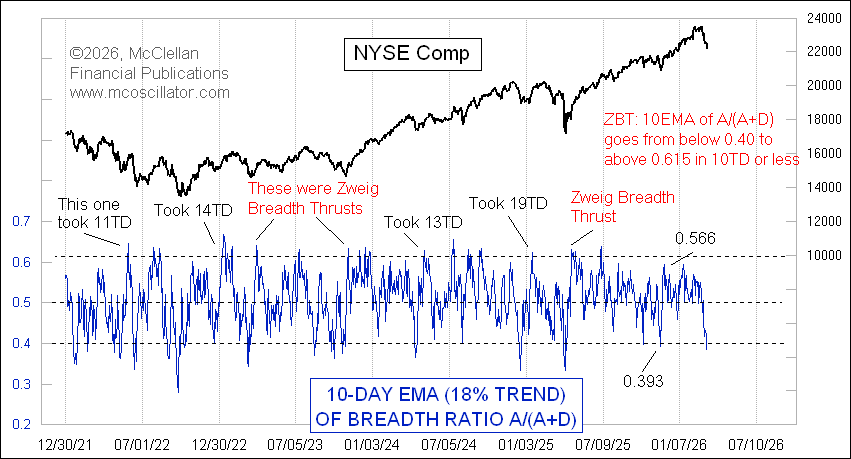
A Zweig Breadth Thrust is obviously not happening now, but Thursday's negative breadth provided the setup for one to potentially happen over the next 2 weeks. The first criterion is A/(A+D) going below 0.40, which marks an oversold condition to bounce from.
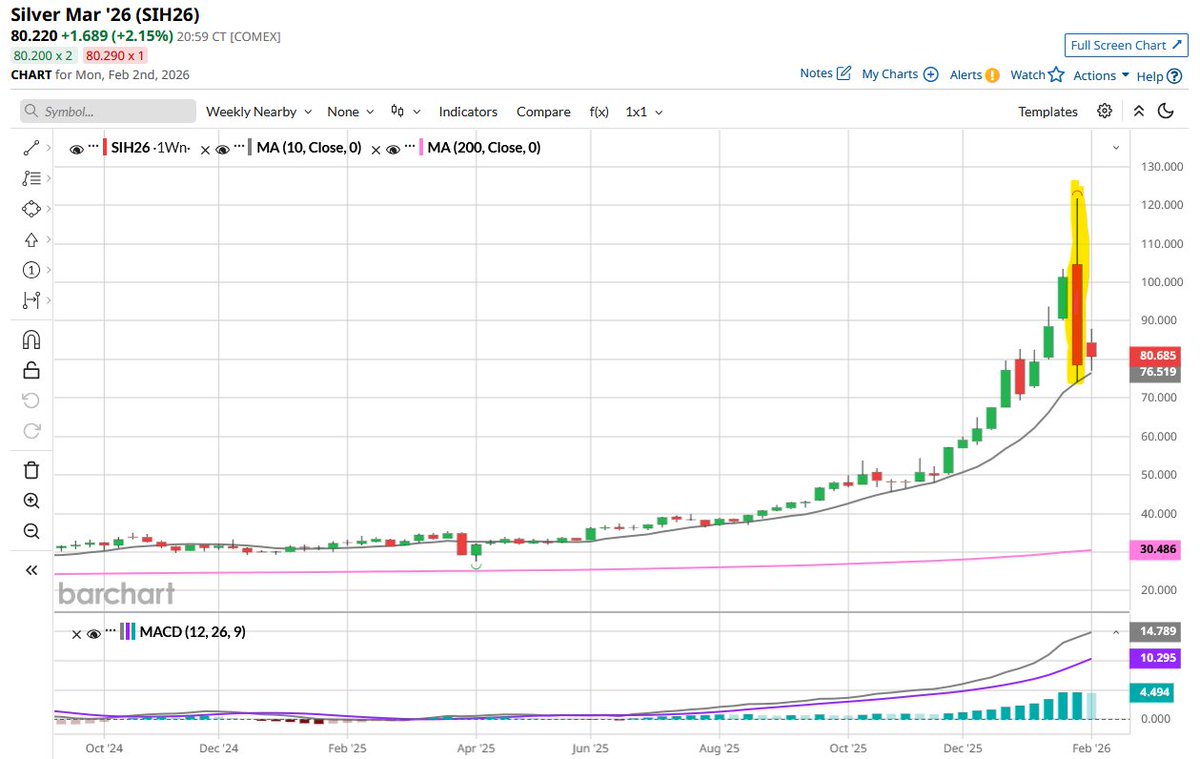
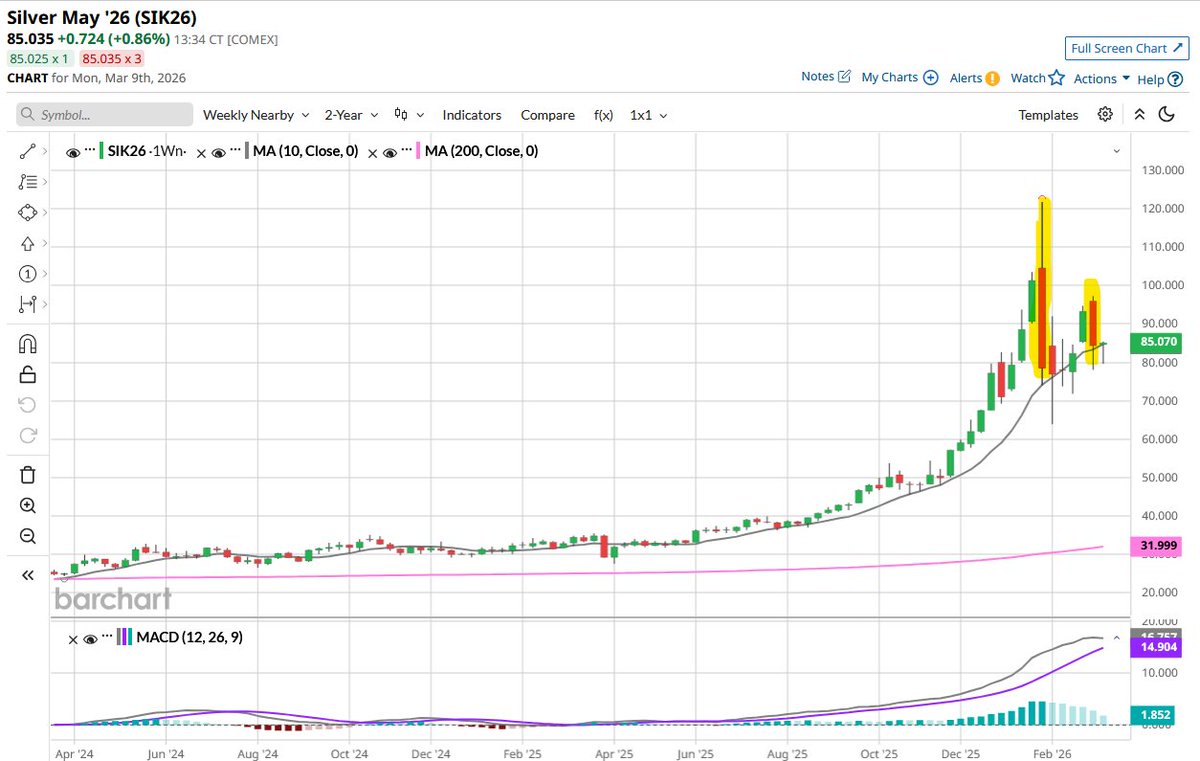
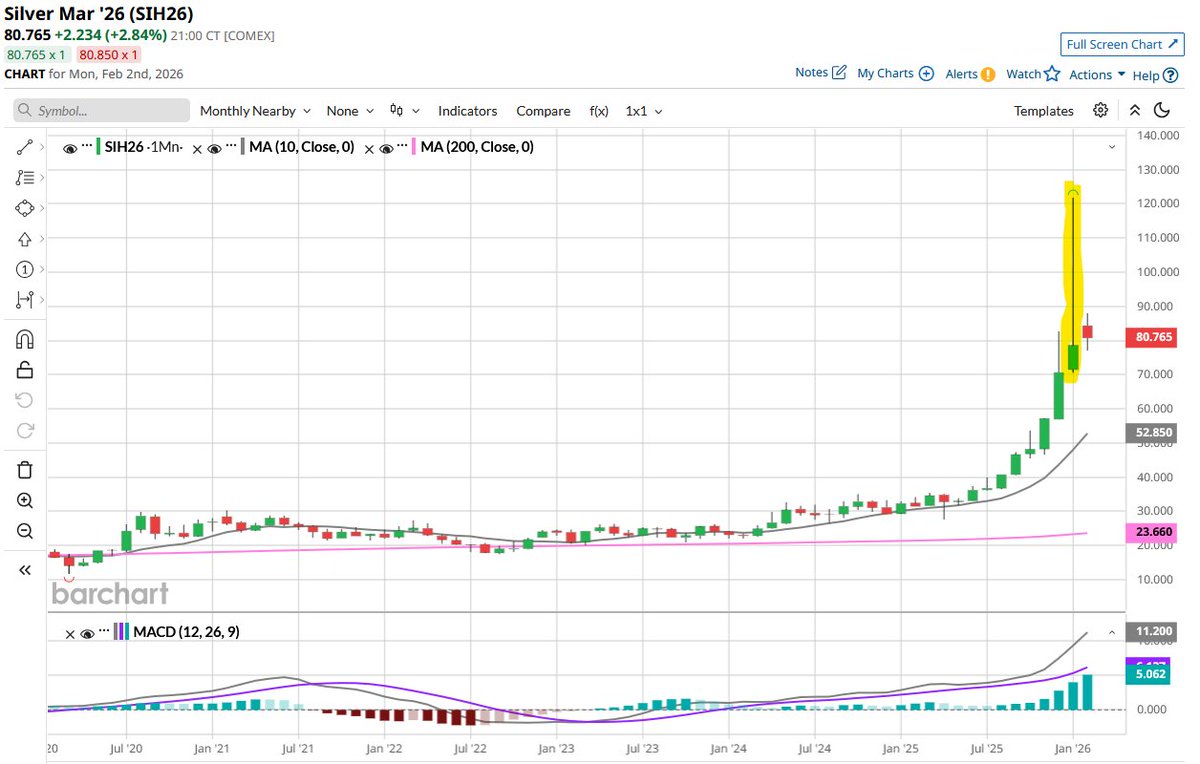
#Silver formed a second bearish engulfing candlestick on the weekly chart. Sideways/down intermediate term. $Silver #SI_F $SLV $SIL #Futures#Commodities $PSLV
#Silver formed a bearish engulfing candlestick on the weekly chart and a bearish shooting star candlestick on the monthly chart. Sideways/down intermediate term. $Silver #SI_F $SLV $SIL #Futures#Commodities
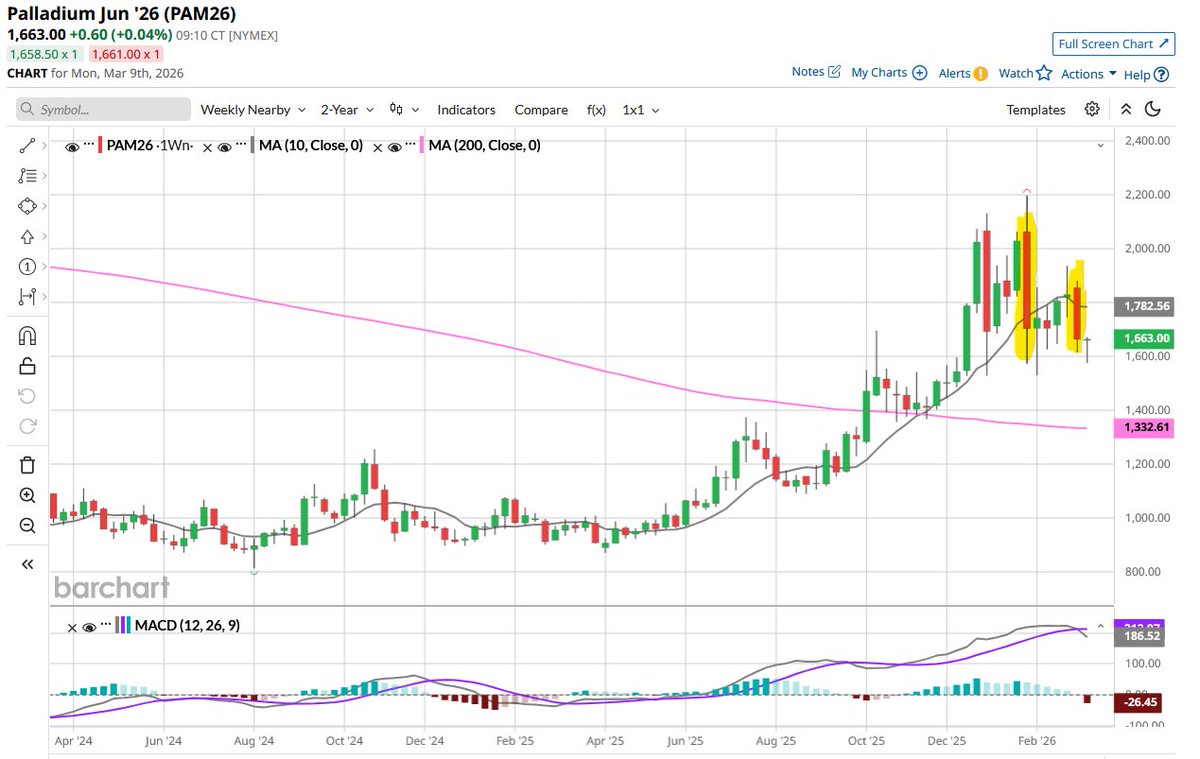
After forming a bearish engulfing candlestick a few weeks ago and trading sideways, #Palladium has formed another bearish engulfing candlestick on the weekly chart. Sideways/down intermediate term. $Palladium #PA_F $PALL #Mining#Futures#Commodities
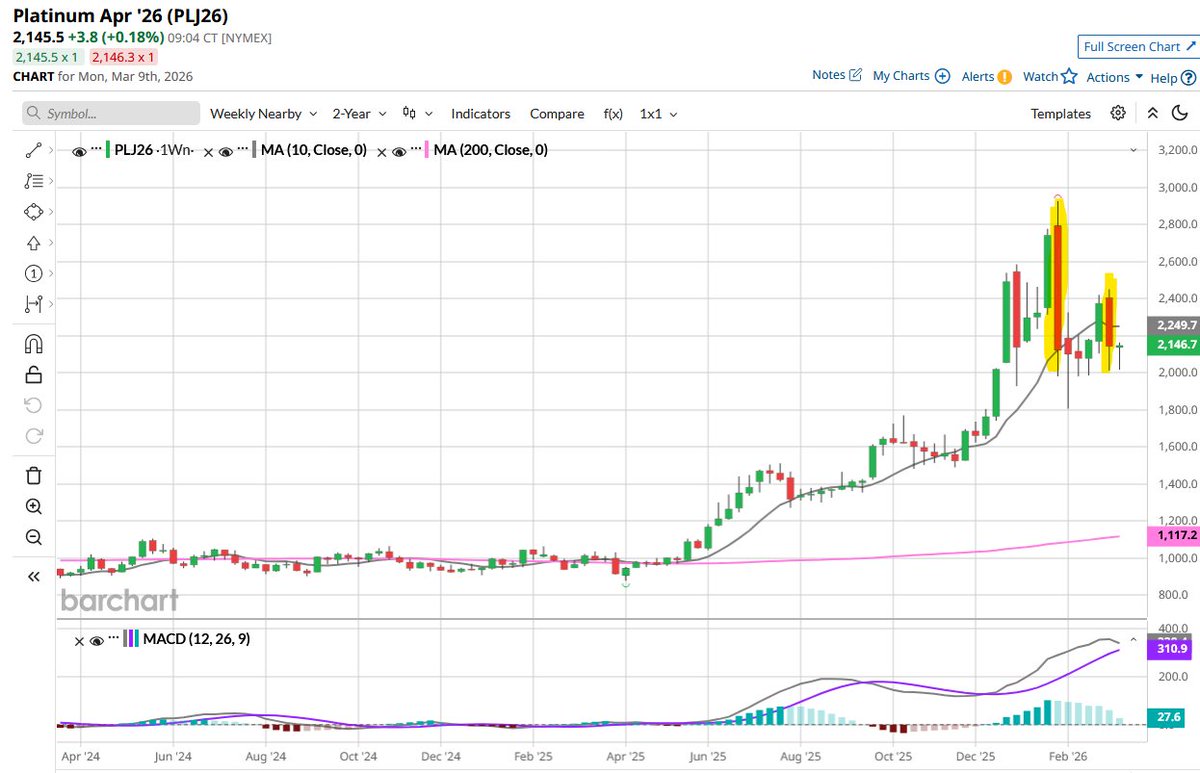
#Platinum formed another bearish engulfing candlestick on the weekly chart after going sideways for a few weeks. Sideways/down intermediate term. $Platinum #PL_F $PPLT $PLAT
#Futures#Commodities
#Platinum formed a bearish engulfing candlestick on the weekly chart. Sideways/down intermediate term. $Platinum #PL_F $PPLT $PLAT #Futures#Commodities
The short US bond trade is very crowded:
Short interest in the popular Treasury bond-tracking ETF, $TLT, is up to a record 150.5 million shares.
This is 10 TIMES above levels seen in March 2023, which stood at ~15 million shares.
Short interest has TRIPLED since 2024 despite the $TLT price remaining flat over this period.
Long-term Treasuries have been in a bear market for nearly 6 years now.
Since April 2020, $TLT has declined -40%, with the biggest drawdown reaching -47% in October 2023.
Long-term bonds are more hated than ever.
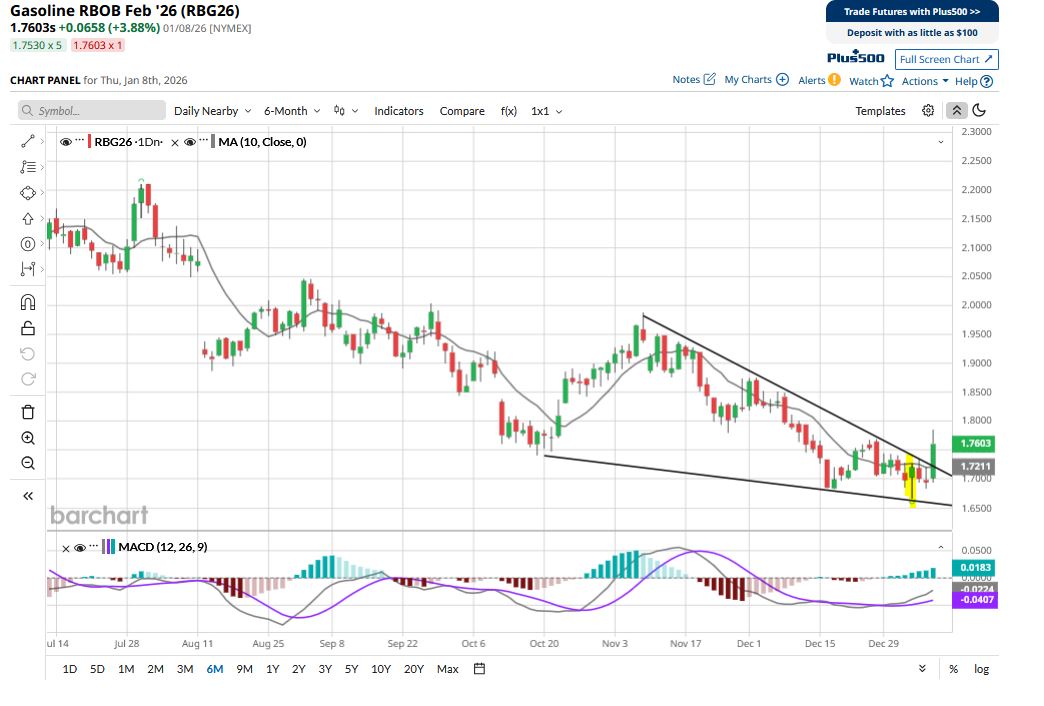
#Gasoline formed a bullish hammer candlestick several days ago and then broke out of a bullish declining wedge formation today. Sometimes the signals for crude oil appear in the derivatives. #RB_F $UGA #RBOB
#RBOB Gasoline continues to rally after breaking out of the bullish declining wedge and forming a bullish hammer candlestick last week. $UGA #Futures#Commodities#OOTT#RB_F