Technical Analyst - Editor of The McClellan Market Report. Trying to figure out stock market physics, and to leave my campsite cleaner than how I found it.
"Everyone times the market. Some people buy when they have money, and sell when they need money, while others use methods that are more sophisticated."
- - Marian McClellan (1934-2003), co-creator of the McClellan Oscillator and Summation Index https://t.co/Klktg9ZX3Y
Esto es interesante...
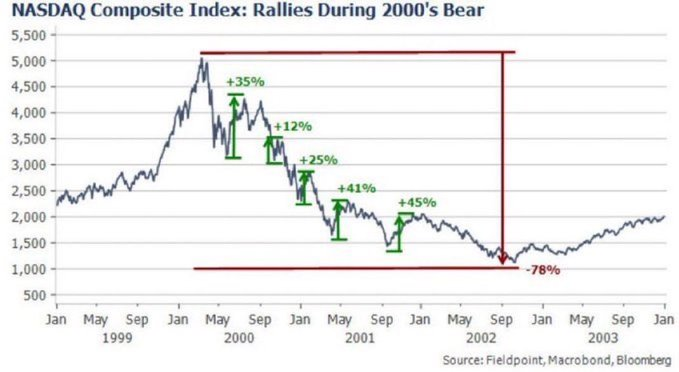
Incluso cuando se producen mercados bajistas en el Nasdaq (como el que se produjo en el año 2000), se generan grandísimas oportunidades de inversión.
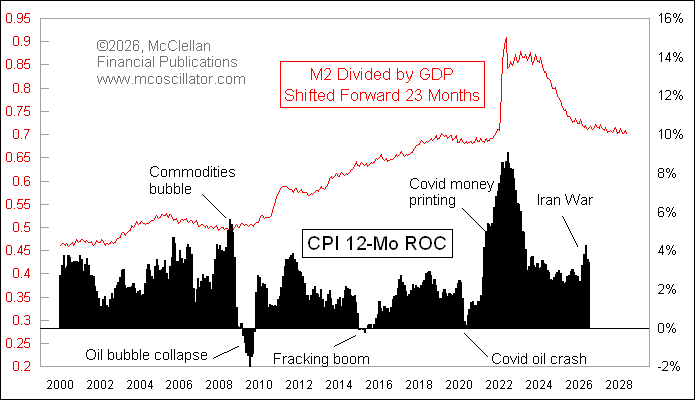
M2/GDP gives a pretty good 23-month leading indication of what inflation is going to look like. Exogenous events come along occasionally, and the Iran War seems to fit that model. Such events typically get followed by an oversteer the other way. The flat-to-down M2/GDP ratio says we do not have much to worry about.
@MerriamWebster WETSU is a GI psychological response to the situation of FUBAR. We Eat This S#|+ Up means we continue to thrive under conditions that would vanquish most people.
Yes, KWHY was UHF channel 22 in L.A. which pioneered doing business news before CNBC, before FNN. Gene Morgan hosted an end of day chart analysis program called Charting The Market. He invited my father on in 1969, and Gene was the person who coined the term "McClellan Oscillator". It was popular with viewers, and became a daily feature of that program. That coverage helped many people become aware of the Oscillator.
More important, Gene's show conveyed the message to the masses that a person could look at a chart and get useful information from it. In the 1960s, that was considered heresy. Gene continued his show until retiring in 1995, after which Frank Barbera took over and kept it going for several more years until the station folded its stock market coverage.
In the early years, Gene Morgan's show was sponsored by The Trade Levels Report, a newsletter published by the late P.N. "Pete" Haurlan, who was an actual rocket scientist at JPL, and the first person west of the Mississippi to use a computer to do stock market analysis. He had access to JPL's enormous computer, and would code IBM cards with stock market data and run analysis on it at night when the computer was not busy. Haurlan was the one who introduced the math of exponential moving averages (invented in the 1950s) for tracking stock prices, because he had used that math in JPL's calculations for how to steer rockets.
KWHY pioneered other aspects of stock market news reporting, including the scrolling ticker at the bottom of the screen, and bringing in guest experts to talk about what the market was doing (and going to do).
@McClellanOsc I want to say he was on channel 22? KWHY? In LA. Circa 1990. I was a college student and didn’t have cable. Tuned into that business station.
My father Sherman McClellan is 92, and still working with me every day. He just recorded an audio inteview with Ike Iossif, available at https://t.co/DatInoI9Tb.
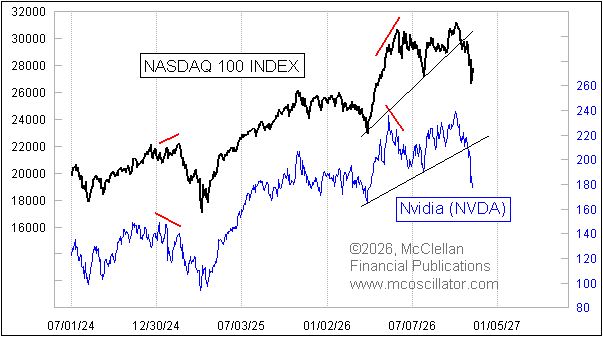
NVDA is down 5.4% while the NDX is up 3.1%. That is a big deviation from normal behavior of the two, especially since NVDA is the heaviest weight component in that index. But this is not the classic type of divergent top condition which marks larger market problems.
It is often risky to say "It's different this time," but drawing technical conclusions on the day when a stock reacts to the CEOs honey trap news is probably an okay exception.
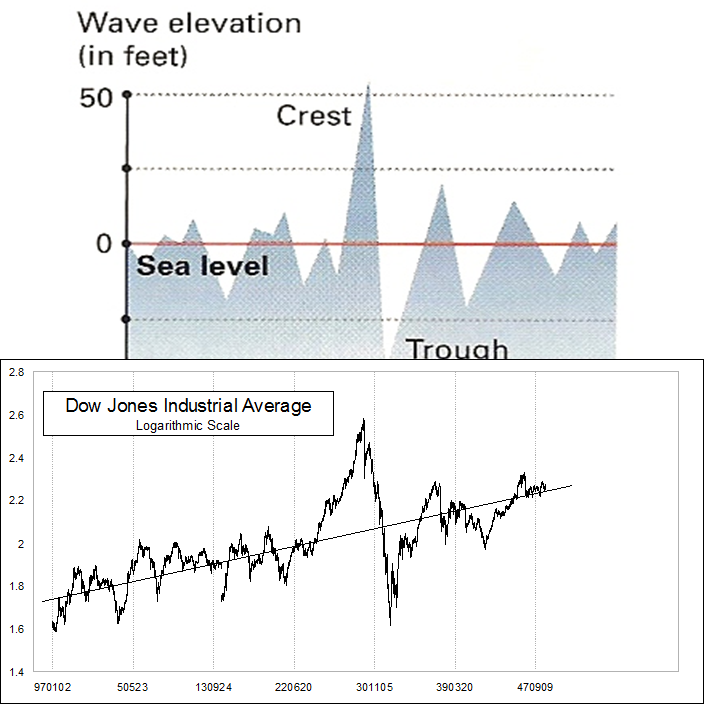
The DJIA has just completed a miniature "rogue wave" structure.
This is a term I have borrowed from oceanographic studies of actual rogue surface waves. They also occur in voltage fluctuations, traffic waves, and other fluid phenomena. The basic principle is that a rogue wave "borrows" energy from adjacent waves, making both the crest and the trough much bigger and more destructive.
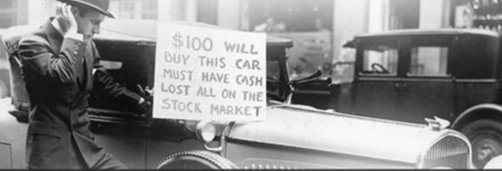
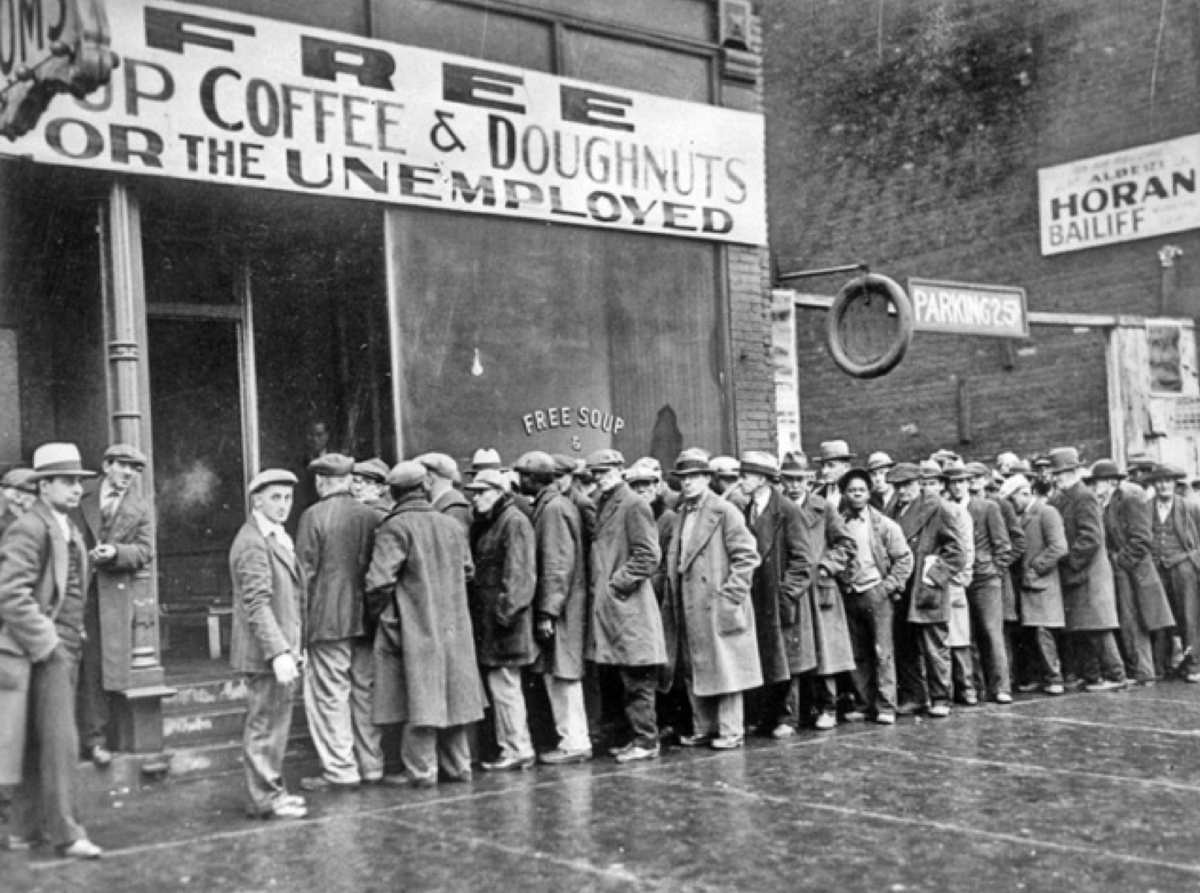
The best example in history of a rogue wave was the 1929 peak and 1932 trough. In the graphic below, I compare that period to the plot of an actual rogue wave detected in the ocean, and recorded by the MaxWave project as it passed through an offshore oil rig. Note that the peak and trough are both equidistant from mean sea level.
The same principle applies to rogue waves in the stock market. What "sea level" refers to is different, and in my observations it usually means returning back to the prior trend.
In the daily chart, we see the DJIA is now returning to where it was before the post-election celebration and then the Nov. 5 microcrash. The pilot will be turning off the Fasten Seat Belt lights, and the market can now get back to tracing out its normal bullish November seasonality.
@double_eagle7 What will be the "prior trend" that prices return to after the rogue wave is a determination much more easily made in retrospect than in real time.
@WEschenbach@curryja What could they have said about you, Willis? You're just a guy who understands data better than pretty much everyone, and you post observations which are defensible. That's boring, and won't sell magazines.