Financials, KPIs and guidance history, standardized and verified, for about 4,000 U.S. companies since 2010. Research on the site, in Claude or by API.
Website:
$NET now has 5,006 customers paying it over $100K a year, up 25% from 4,009 a
year ago, and 3.3x the 1,537 of Q1 2022.
Q3 2026 revenue: $782.5M, +39%.
Q4 guide: $845–846M.
The stock is 15% below its Oct 9 high of $360.95.
$TCOM revenue: ¥62.4B in 2025, 75% above pre-COVID 2019.
H1 2026 revenue grew 11%. But a ¥5.2B fine from China's market regulator cut H1 operating income by 68%. The stock is 44% below its January high.
$BHP dividends for FY26: $1.72 a share (73¢ interim + 99¢ final).
Up 56% from FY25's $1.10, and the highest since FY22.
One ADR = two shares, so $3.44 per ADR. The final dividend was paid Sep 23.
$JD operating income fell 93% in 2025, to ¥2.8B.
H1 2026: ¥8.4B, already 3x all of 2025. But still 14% below H1 2025's ¥9.7B.
Revenue in H1 2026: +0.7%.
The stock is 74% below its Feb 2021 high.
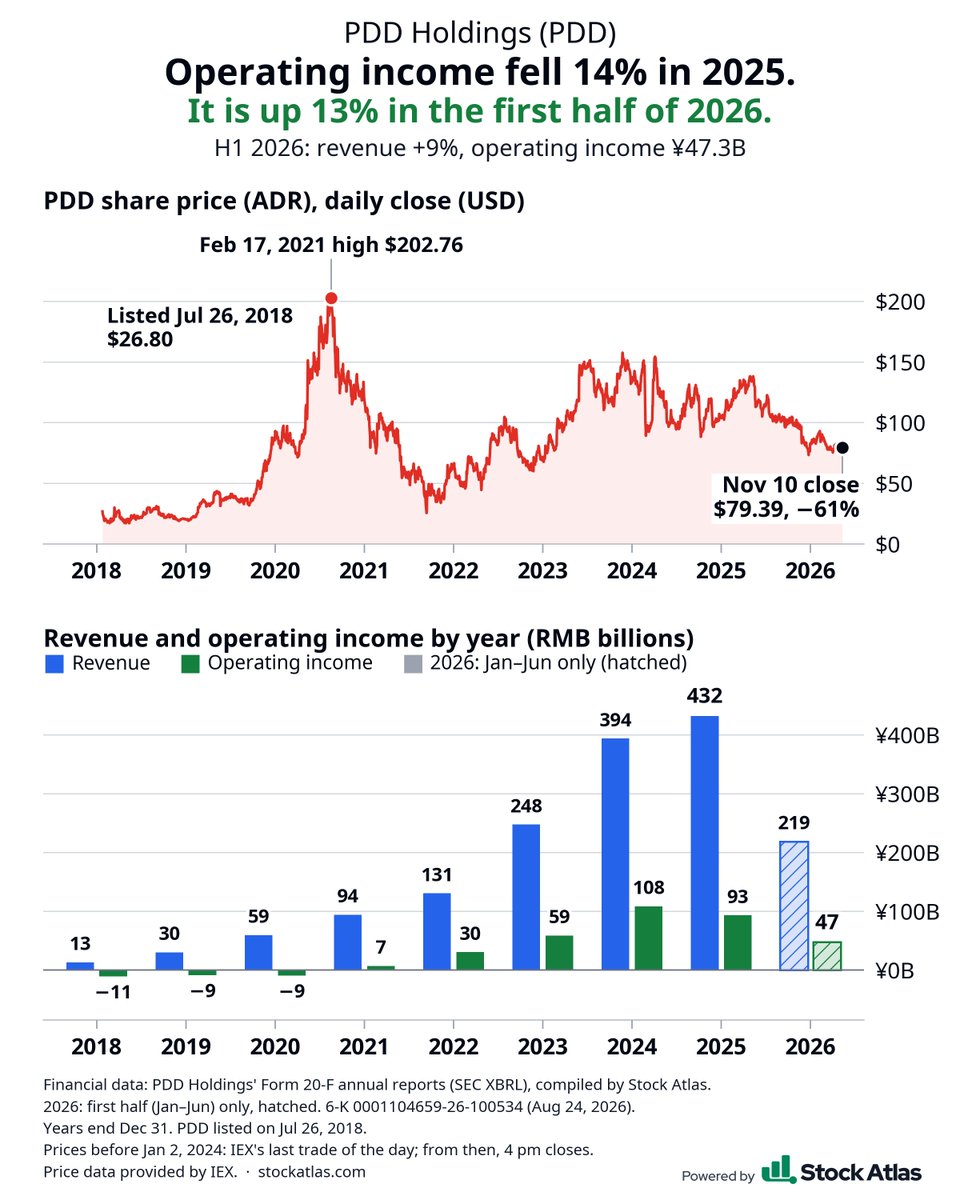
$PDD operating income fell 14% in 2025, its first drop since turning a profit in 2021.
It is growing again: +13% in the first half of 2026, to ¥47.3B. Revenue +9%.
The stock is 61% below its Feb 2021 high.
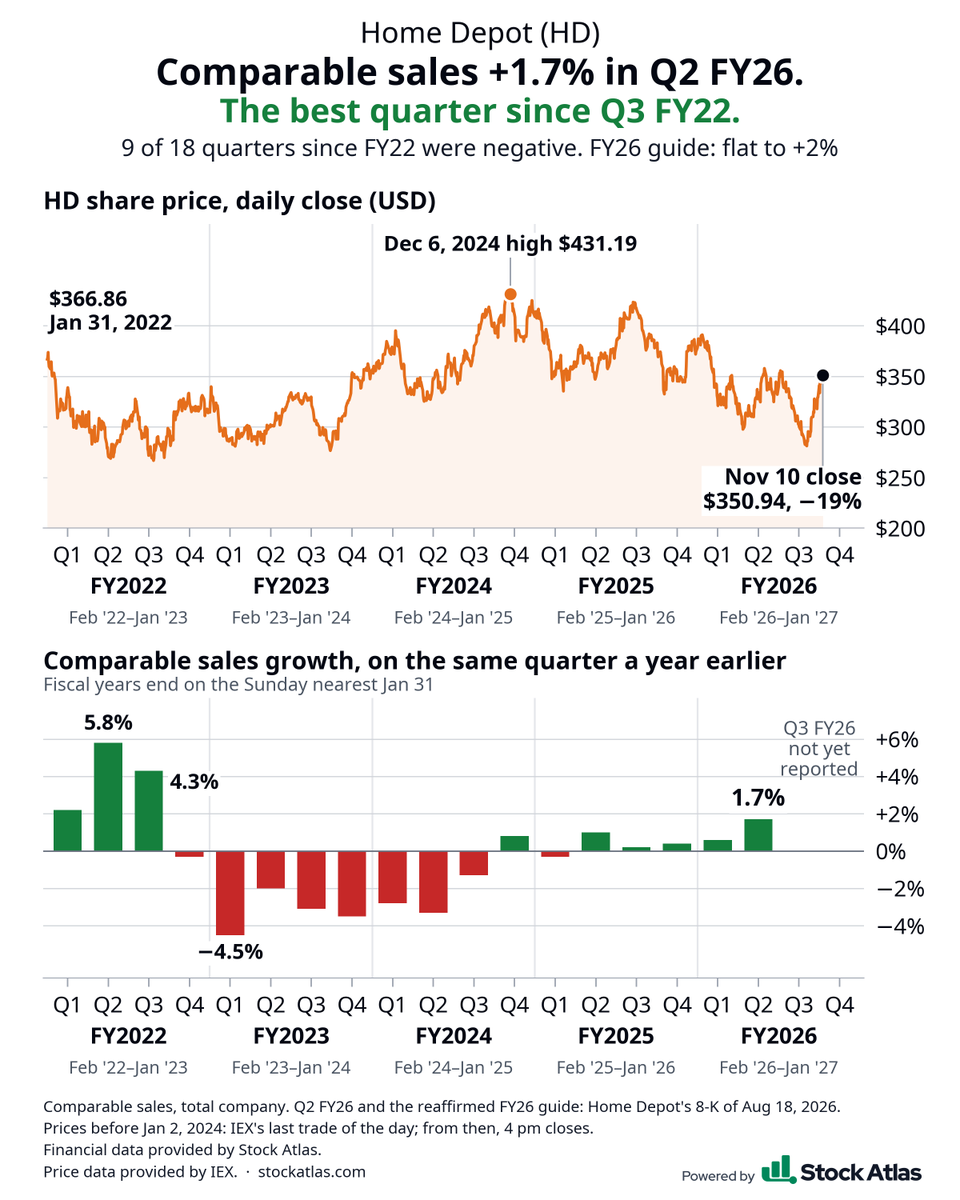
$HD comparable sales: +1.7% in Q2 FY26.
The best quarter since Q3 FY22 (+4.3%).
9 of the last 18 quarters were negative, including 8 in a row from Q4 FY22 to Q3 FY24.
FY26 guide, reaffirmed: flat to +2%.
The stock is 19% below its Dec 2024 high.
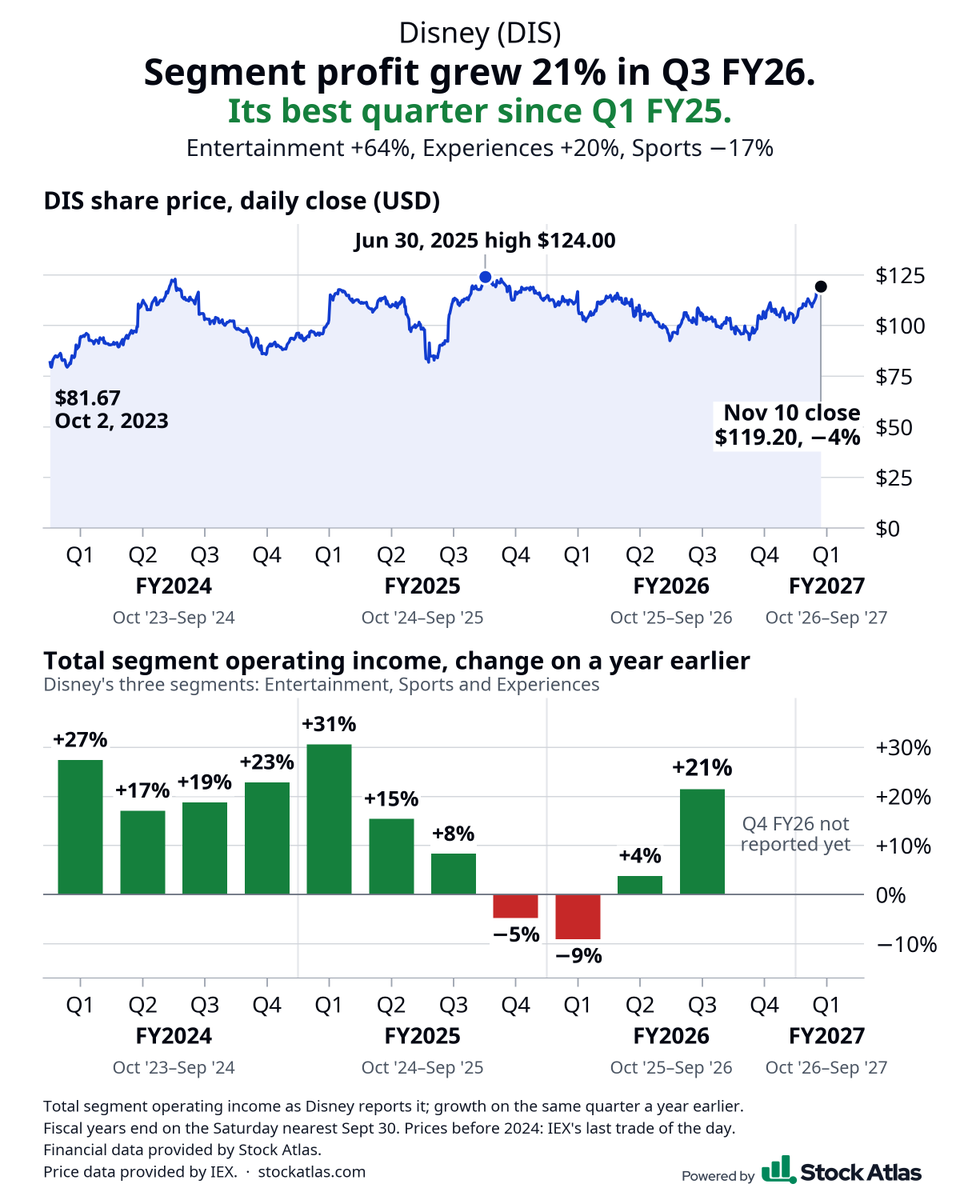
$DIS segment operating income grew 21% in Q3 FY26, to $5.56B. Its best quarter
since Q1 FY25.
Entertainment +64%
Experiences +20%
Sports −17%
Q4 FY25 and Q1 FY26 had fallen 5% and 9%.
The stock is 4% below its Jun 2025 high.
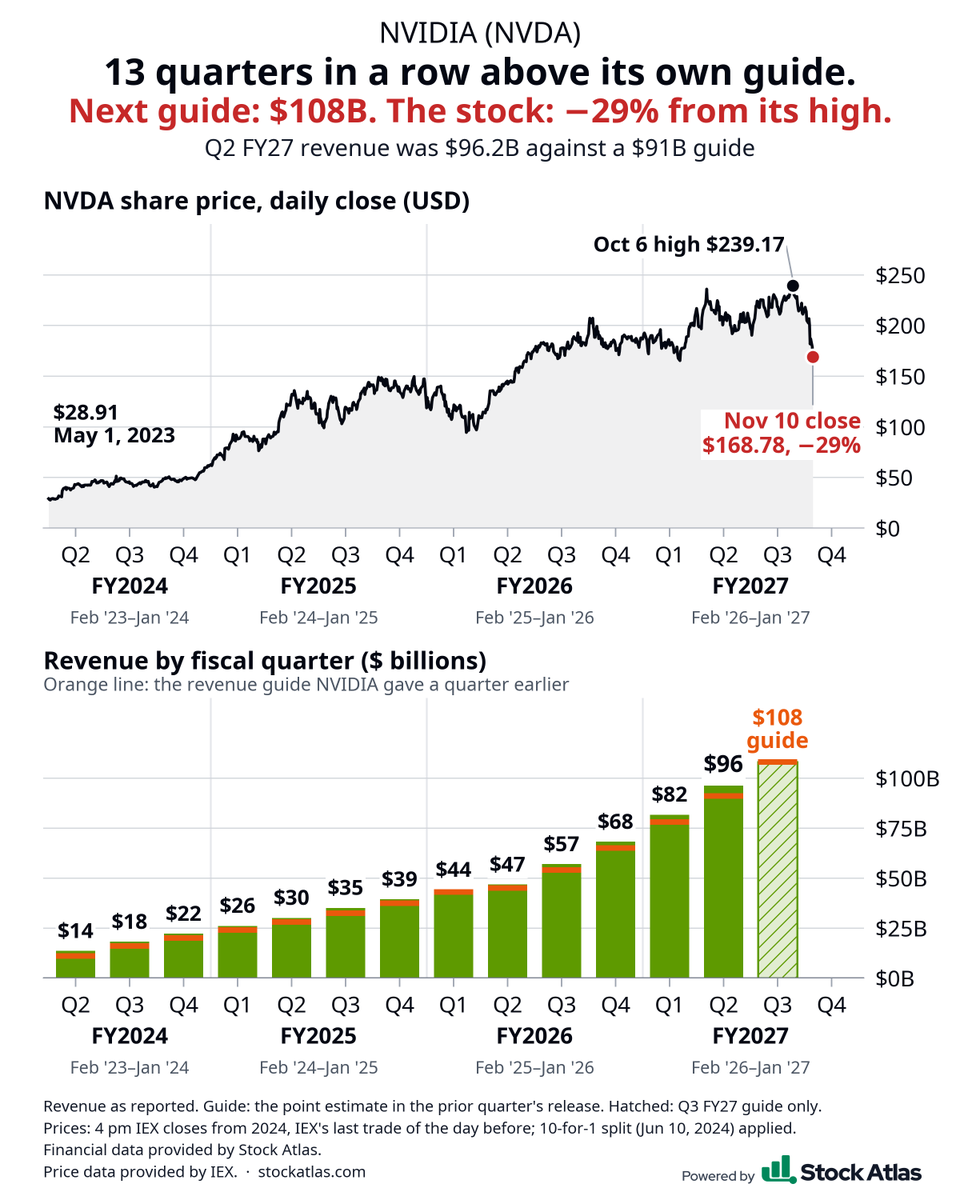
$NVDA has beaten its own revenue guide 13 quarters in a row.
Q2 FY27: $96.2B against a $91B guide.
Next guide: $108B, 12% above Q2.
The stock is 29% below its Oct 6 high of $239.17.
@DannyDayan5 Interesting chart. How did stocks perform in the months after leverage was cleaned out on Liberation Day and at the 2022 bottom? I'd be interested in the range of outcomes.
@dailychartbook Interesting history. How did the S&P 500 perform in the months after the 11-week risk-off signal ended in 2022? I'd be interested in the range of outcomes after long signals like this.
@CalebFranzen Nice chart. Has volume picked up as Nasdaq-100 futures reclaim the 200-day MA cloud? I'd be interested to see whether they can hold above it through the close.
@ShortSeller Interesting read. The weekly does look like a potential bear flag on $SMH. Would a weekly close back above the lost trendline be what shifts you toward the monthly wick scenario?
$TSN Beef has lost money in 11 of the last 16 quarters: $1.96B of operating losses over the last 12 alone Chicken earned $389M in Q3 FY26. Beef lost $142M.
Consumer staples and long-term Treasuries are supposed to provide defensive exposure, but the last decade tells an interesting story.
Since December 2016:
• Consumer staples have underperformed the S&P 500 by nearly 48%.
• Long-term Treasuries have fallen roughly 30% in price.
• Their weekly correlation is just +0.18.
Two defensive assets, but very different behavior.
$XLP $SPY $TLT
Emerging-market stocks have underperformed the S&P 500 for decades.
The MSCI Emerging Markets/S&P 500 ratio is just 0.21, below its 1999 and 2001 lows.
After nearly 40 years of relative performance history, are emerging markets historically undervalued—or is U.S. dominance here to stay?
$EEM $SPY
@decodejar I like your chart. This looks like a potential rising wedge on $NVDA, with RSI making lower highs. What price level would you watch to confirm the higher-low structure has broken?
@nextbigtrade Thanks for the chart. That long upper wick on the $V weekly stands out. Would you wait for a close below the prior week's low before treating it as a potential failed breakout?
@MilkRoadStocks Nice comparison. How much of $AAPL's 28.5% gain came from earnings growth versus a higher P/E? I'd be curious how that compares with $NVDA at -9.2%.
@BourbonCap Nice chart. How much of $NVDA's rise from a $50B market cap came from earnings growth versus a higher valuation multiple? I'd be curious how that split looks over the ten years.
@MMMTwealth Nice breakdown. Has management indicated when the $179B backlog should turn into revenue for $AVGO? I'd be interested to see how that lines up with the $30 EPS you're modelling for FY28.