We measured the engineering performance of 676 developers across OpenAI, Google, Meta, Microsoft, Cloudflare, and Vercel in OSS.
Average engineering performance is up +116% year over year. Full methodology on https://t.co/q32WO9uKBB.
The breakdown by company surprised us:
OpenAI +373%
Cloudflare +157%
Microsoft +137%
Vercel +92%
Google +56%
Meta +51%
A few things worth knowing:
We froze the population to 418 developers active every quarter. Output still grew +98%. Not a cohort artifact.
The mix shifted toward new feature work, not cleanup. Maintenance share fell from 56% to 46%. If AI was creating slop to fix later, you'd expect the opposite.
The window coincides with broad AI coding tool adoption. We're not making a causal claim. We're showing what the commits did.
Full methodology and data: https://t.co/q32WO9uKBB
Token maxing is not the problem.
A team burning tokens is fine, as long as those tokens turn into shipped roadmap work. The problem is when you can't tell the difference. Most teams can't. The AI bill climbs, the velocity charts stay flat, and everyone guesses. That's expensive guesswork.
We've been researching this. Three numbers tell you whether token maxing is working or just burning money.
Performance per developer, per month
Measure it in ETV. ETV is how much complex work a developer actually ships in a month. Above 10 ETV per month is a healthy signal for an AI-native team.
AI efficiency
Tie that performance to the spend and you get the cost of one ETV. With an Anthropic team license, under $20 per ETV is a good number today. It moves daily as tool prices change, and you can fold in code review and the rest of your AI workflow.
Was it on the roadmap?
This is the one that matters most. Was the work, and the spend, tied to an Epic or initiative? Or was the team off building something nobody asked for? We call that unaligned work.
Put it together. An engineer ships 50 ETV in a month, spend runs high, and 75%+ of the work maps to the roadmap. Give that person more tokens.
50 ETV in a single month already puts someone in the top 1% of developers worldwide (based on the 500 OSS Performance Index). Hold it across a quarter with under 18% going to bugs and fixes, and you're not managing a heavy token user. You're managing an exceptional engineer.
Token maxing isn't the risk. Not knowing what it bought you is.
Token maxing is not the problem.
An engineering team burning tokens is fine, as long as those tokens turn into shipped roadmap work. The problem is when you can't tell the difference. Most teams can't. The AI bill climbs, the velocity charts stay flat, and everyone guesses. That's expensive guesswork.
We've been researching this. Three numbers tell you whether token maxing is working or just burning money.
Performance per developer, per month
Measure it in ETV. ETV is how much complex work a developer actually ships in a month. Above 10 ETV per month is a healthy signal for an AI-native team.
AI efficiency
Tie that performance to the spend and you get the cost of one ETV. With an Anthropic team license, under $20 per ETV is a good number today. It moves daily as tool prices change, and you can fold in code review and the rest of your AI workflow.
Was it on the roadmap?
This is the one that matters most. Was the work, and the spend, tied to an Epic or initiative? Or was the team off building something nobody asked for? We call that unaligned work.
Put it together. An engineer ships 50 ETV in a month, spend runs high, and 75%+ of the work maps to the roadmap. Give that person more tokens.
50 ETV in a single month already puts someone in the top 1% of developers worldwide (based on the 500 OSS Performance Index). Hold it across a quarter with under 18% going to bugs and fixes, and you're not managing a heavy token user. You're managing an exceptional engineer.
Token maxing isn't the risk. Not knowing what it bought you is.
AI ROI calculator for engineering built on top of open-source repositories like VS Code, Codex, etc.
What do you think?
more on https://t.co/amzfZjqJiv
@Medium@MediumSupport
Can you please help me get my article index on google?
Thank you.
My article has been visible on medium for several weeks.
But still not on google, only my reading list.
Any ideas?
https://t.co/a7vTpl1SY1
Live tracker of engineering performance across OpenAI, Microsoft, Vercel, and more.
Most engineering benchmarks are outdated the moment they're published. We rebuilt the baseline as a live feed: 500 OSS repos, updated daily.
Median engineering performance is +138% since Apr '25.
See where your team sits: https://t.co/mNTMJM4WkM
How to spot a high-performing engineering team in Q2 2026?
Three key numbers to watch.
1. Performance: 10 ETV* per dev per month
Average team member shipping 15 ETV* per month, split roughly 40% new value, 40% maintenance, 20% fixes. Hit that and you're a high-performing team.
The trap: skip process, hand the keyboard to Claude Code, watch weekly output spike. Then crash. Fix rates climb. Codebase stops being maintainable. That's not performance. That's debt compounding faster.
2. Alignment: 75% on roadmap
Is the work tied to something product or the company actually planned, or did it just happen? Hit 75% aligned and you're ahead of most teams.
3. AI efficiency: under $15 per ETV
AI spend per ETV delivered. Target is $10. Hit under $15 and engineering should get an open AI budget, that you monitor closely.
Yes, Goodhart's Law
Any metric becomes a target. Any target gets gamed.
Show me how you game all three at once. High Engineering Throughput Value with no rise in bugs or maintenance load, fully aligned to roadmap, cost-efficient on AI spend. That's not gaming. That's doing the job.
That's it.
This isn't about which epic brings the most value or how to score initiatives. Different conversation. This one assumes you already know what you want shipped and it's on the roadmap. The question is whether your team is actually delivering it, in alignment, at a sane cost.
*ETV = Engineering Throughput Value. Full methodology at https://t.co/q32WO9ucM3.
If you're already tracking these, you know how rare it is. If you're not, that's your Q3.
"Is my engineering good enough?" I'm getting this question from CEOs every week.
It usually starts with AI. Are we using it as much as other companies?... and then we have a long debate about how AI is not just a button you turn on... and that it's about much more than just a license on Claude Code or other tools, and the question is really complicated and it's a process of changing the behaviour of teams at scale...
But the debate ends with: I think Anthropic is shipping so much faster than we are. I'm seeing other startups that are delivering at crazy speed, my engineering is behind. So I realised that this is a trust issue between management of a company and engineering that is going through transition.
And when this occurs, you can argue with the CEO (non-technical) with AI spend or PRs or DORA.
The only thing working, based on what I can see, is showing a benchmark to other companies at similar stage, size, etc.
Btw, I've noticed that a benchmark, even with the wrong ones, is OK when the % growth looks similar YoY 😂.
And the real reason they're asking? They're deciding whether to replace their CTO.
OpenAI Codex - Record Development Performance for April
New performance data reveals a significant surge in development activity for OpenAI Codex during the month of April.
The project’s Engineering Throughput Value (ETV) reached a record high of 338, representing a 111% increase over the five-month rolling average.
Full details:
https://t.co/qxfCq4Iy4k
OpenAI Codex - Record Development Performance for April
SAN FRANCISCO — New performance data reveals a significant surge in development activity for OpenAI Codex during the month of April. The project’s Engineering Throughput Value (ETV) reached a record high of 338, representing a 111% increase over the five-month rolling average.
Architectural Overhaul Drives Maintenance Surge
The data shows a 163% increase in Maintenance ETV, signaling a strategic shift toward structural stability. Key technical milestones merged into the main branch include:
Subsystem Decoupling: The plugin management system was migrated into a dedicated codex-core-plugins crate.
Standardized Interfaces: A new public API facade was established via the codex-core-api crate to ensure consumer stability.
Data Persistence: Thread turns were successfully migrated to a centralized ThreadStore.
Security and Feature Growth
Growth ETV rose 76% as the team delivered several high-impact features. Security updates were a primary focus, featuring the introduction of Windows WFP filters and Linux metadata protections to harden sandbox environments.
The update also introduced a /hooks browser for lifecycle management and expanded the "suggestible" allowlist to include Canva, Chrome Extensions, and Microsoft-curated plugins.
By the Numbers
According to the https://t.co/59V2aNkC5W methodology, April’s throughput significantly outpaced previous baselines:
Total ETV: 338 (+111%)
Maintenance: 168 ETV(+163%)
Growth: 135 ETV(+76%)
Fixes: 35 ETV(+75%)
While absolute "Waste" (Fixes/Bugs) increased, the ratio remained consistent with the higher commit volume, which rose 69% to a total of 1,073 commits for the month.
#OpenAICodex #Engineering #SoftwareDevelopment #ETV @sama
@DanielSmidstrup We publish research on this topic :)
Across Google, OpenAI, Cloudflare, Vercel, and Meta in OSS development. Year over year benchmarking.
https://t.co/3NFnp0onzb
OpenAI Codex - Record Development Performance for April
SAN FRANCISCO — New performance data reveals a significant surge in development activity for OpenAI Codex during the month of April. The project’s Engineering Throughput Value (ETV) reached a record high of 338, representing a 111% increase over the five-month rolling average.
Architectural Overhaul Drives Maintenance Surge
The data shows a 163% increase in Maintenance ETV, signaling a strategic shift toward structural stability. Key technical milestones merged into the main branch include:
Subsystem Decoupling: The plugin management system was migrated into a dedicated codex-core-plugins crate.
Standardized Interfaces: A new public API facade was established via the codex-core-api crate to ensure consumer stability.
Data Persistence: Thread turns were successfully migrated to a centralized ThreadStore.
Security and Feature Growth
Growth ETV rose 76% as the team delivered several high-impact features. Security updates were a primary focus, featuring the introduction of Windows WFP filters and Linux metadata protections to harden sandbox environments.
The update also introduced a /hooks browser for lifecycle management and expanded the "suggestible" allowlist to include Canva, Chrome Extensions, and Microsoft-curated plugins.
By the Numbers
According to the https://t.co/59V2aNkC5W methodology, April’s throughput significantly outpaced previous baselines:
Total ETV: 338 (+111%)
Maintenance: 168 ETV(+163%)
Growth: 135 ETV(+76%)
Fixes: 35 ETV(+75%)
While absolute "Waste" (Fixes/Bugs) increased, the ratio remained consistent with the higher commit volume, which rose 69% to a total of 1,073 commits for the month.
#OpenAICodex #Engineering #SoftwareDevelopment #ETV @sama
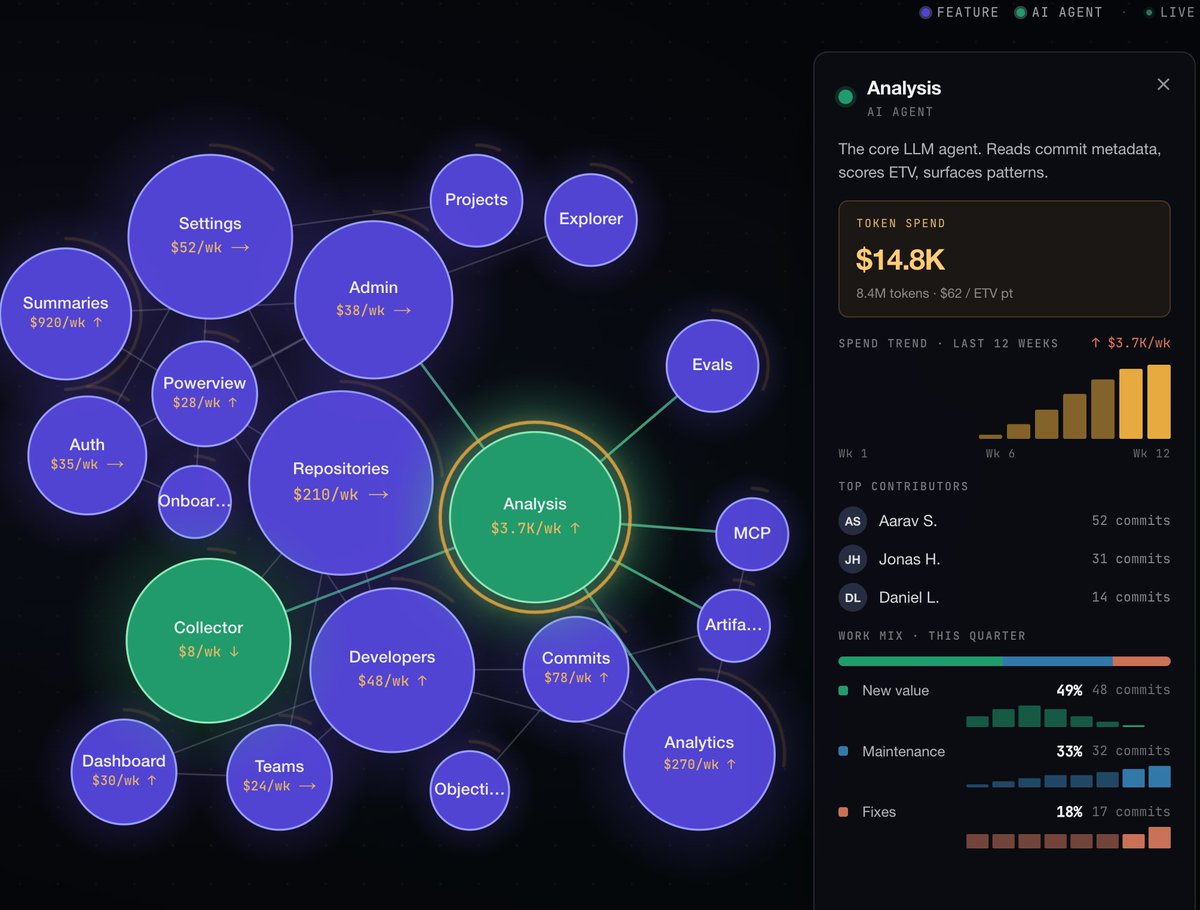
Most teams can't tell you where their AI spend goes.
Per feature. Per commit. Per developer. Tied to real complexity.
→ Which features burn the most AI budget
→ Where you're paying for noise vs real value
→ Which parts of the code had the most bugs/fixes
Not token tracking. Cost vs output.
Beta is open to a few teams.
DM or book: https://t.co/zwYaLLWlMo
#ClaudeCode #AISpend #DevTools
@fi56622380@kvamme We are doing research on this topic in OSS.
Here is the difference in performance of 676 developers who are working on Codex, VS Code, Next.js, etc.
And the shift in Q1 2026 is crazy!
https://t.co/3NFnp0oVoJ
@stevehou We are doing research on this topic in OSS.
Here is the difference in performance of 676 developers who are working on Codex, VS Code, Next.js, etc.
And the shift in Q1 2026 is crazy!
https://t.co/3NFnp0oVoJ