The most reliable buy signal in market history:
Wait for everyone to panic.
Then buy.
Every VIX spike that had people calling the apocalypse was just the market loading up for the next leg higher.
• VIX 20–30 → stay alert
• VIX 30–45 → activate booster
• VIX 45+ → go MAXIMUM
Greed is obvious. Fear is the edge.
When cannons fire, buy.
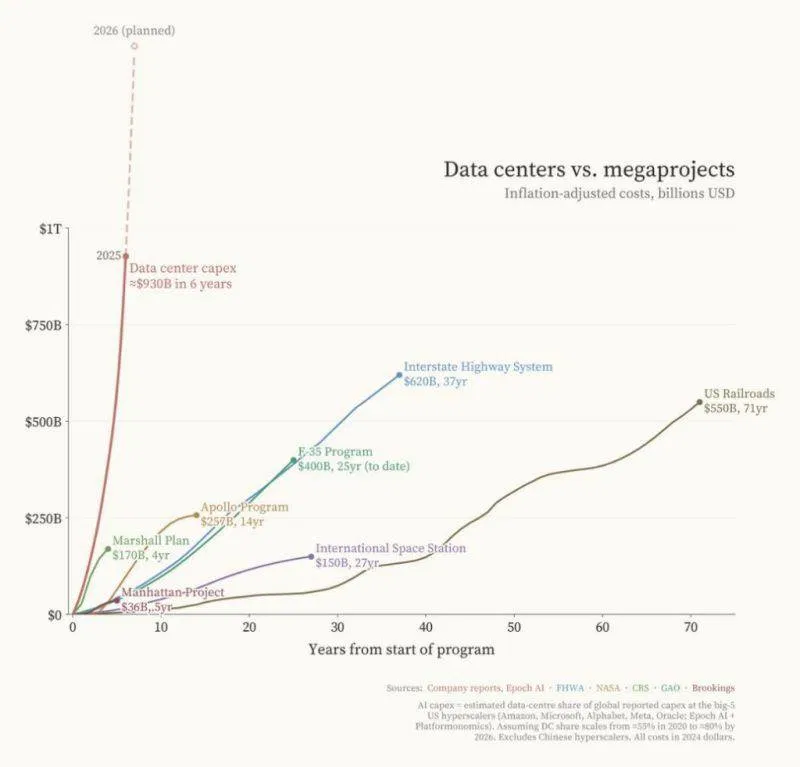
The US is pouring more capital into AI data centers in 6 years (~$930B) than the inflation-adjusted cost of the Marshall Plan, Apollo, Manhattan Project, and the Interstate Highway System — combined.
Meanwhile: AI ≈ 45% of the S&P. Energy ≈ 4%.
Everyone is overweight the thing that needs power. Underweight the power.
H/T @ekwufinance
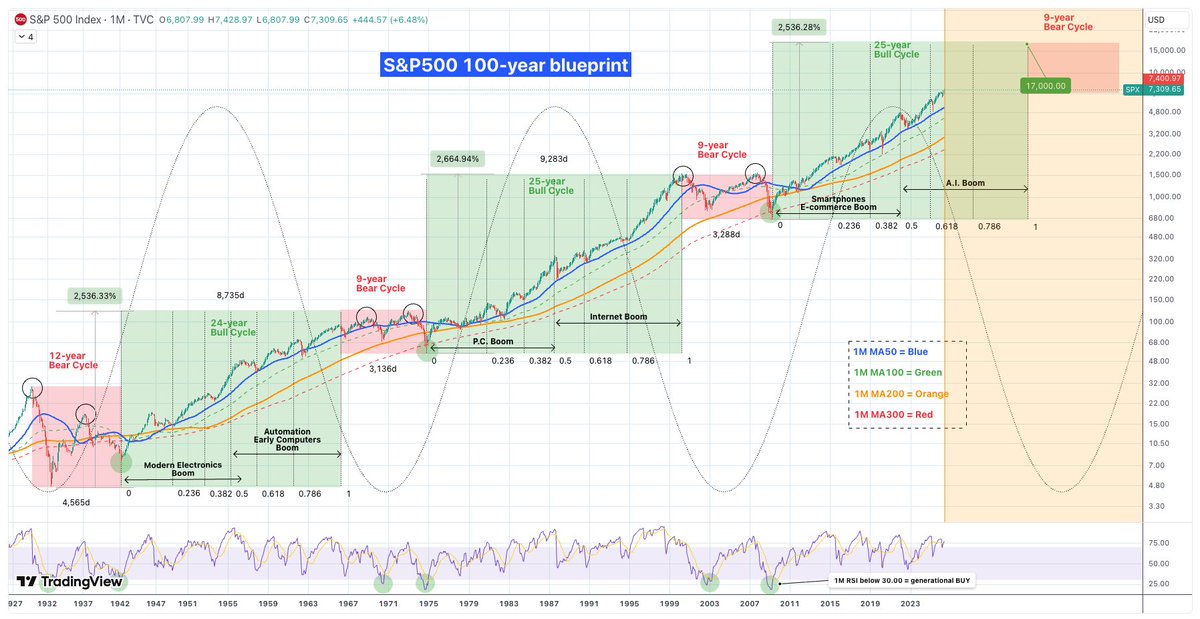
Der 100-Jahre-Plan für den Aktienmarkt
Wenn du dir die letzten 100 Jahre anschaust, siehst du ein klares Muster: Der Markt wiederholt immer wieder die gleichen Zyklen. Seit der Großen Depression 1930 gab es drei große Abwärtsphasen und drei Aufwärtsphasen .
Wir stecken gerade mitten im dritten großen Bullenmarkt.
Die schlechten Zeiten (Bärenmärkte)
Diese Phasen dauerten meistens etwa 9 Jahre (die Weltwirtschaftskrise von 1930 war mit 12 Jahren eine Ausnahme). Ein typisches Zeichen war, dass der Markt zweimal oben und zweimal unten „anklopfte“, bevor es wieder aufwärts ging. Oft krachte der Kurs bis zu einer bestimmten langfristigen Linie (dem 300er-Schnitt im Monatschart) und startete von dort aus neu durch.
Die guten Zeiten (Bullenmärkte)
Die ersten beiden großen Aufwärtsphasen dauerten jeweils 24 und 25 Jahre. Das Spannende: Sobald der Markt einmal Fahrt aufgenommen hatte, fiel er fast nie unter eine bestimmte grüne Linie (den 100er-Schnitt). Die blaue Linie (50er-Schnitt) war dabei immer die beste Chance, um günstig nachzukaufen, wenn es mal zwischendurch ruckelte.
Warum steigt der Markt so extrem?
Hinter jedem Bullenmarkt steckt eine neue Technologie:
Früher waren es industrielle Durchbrüche.
Dann kam der Internet-Boom.
Heute erleben wir den E-Commerce- und Social-Media-Boom.
Klar, irgendwann platzen diese Blasen immer, weil die Leute übertreiben. Aber die Technik bleibt! Das Internet ist nicht verschwunden, nur weil die Kurse im Jahr 2000 abgestürzt sind – es wurde zum Fundament für alles, was wir heute nutzen.
Der KI-Boom
Wir sind jetzt im zweiten Teil des aktuellen Aufschwungs, und der wird von der Künstlichen Intelligenz getrieben. Wahrscheinlich wird diese Blase um das Jahr 2034 platzen. Das wird wehtun, aber danach wird KI das feste Rückgrat unserer gesamten Wirtschaft sein.
Im Grunde sind die letzten 100 Jahre eine Kette von Erfindungen, die die Kurse immer höher treiben. Die Abstürze zwischendurch sind nur dazu da, die heiße Luft rauszulassen und Platz für neues Geld und die nächste Technologie zu machen.
Was bedeutet das für dich heute?
Wenn dieser Zyklus so läuft wie die letzten beiden, könnte der S&P 500 bis auf 17.000 Punkte steigen.
Es wird zwischendurch immer wieder Korrekturen geben. Der Zoll-Crash Anfang 2025 war so ein Moment, hat aber die wichtige blaue Linie nicht ganz berührt.
Schau auf den RSI-Anzeiger. Wenn der unter 30 fällt, ist das eine Chance des Jahrzehnts. Das ist in 100 Jahren erst sechsmal passiert – und jedes Mal war es der perfekte Zeitpunkt zum Kaufen.
Liken, Folgen, Speichern, Kommentieren, Teilen.
Danke für den Support 🫶😊🫶
Robert Cialdini’s book Influence: The Psychology of Persuasion became one of Munger’s favorite books
He called it “one of the best books ever written” on human psychology and persuasion
And then Munger did something extremely rare:
He gave Cialdini a share (or shares) of Berkshire Hathaway stock as a gift
Munger Invited Cialdini to speak at Berkshire Hathaway
Personally thanked him for writing the book
Said the ideas in Influence were essential for understanding human misjudgment
Recommended it repeatedly in speeches and shareholder meetings
Contributed to the book’s reputation in the business and investing world
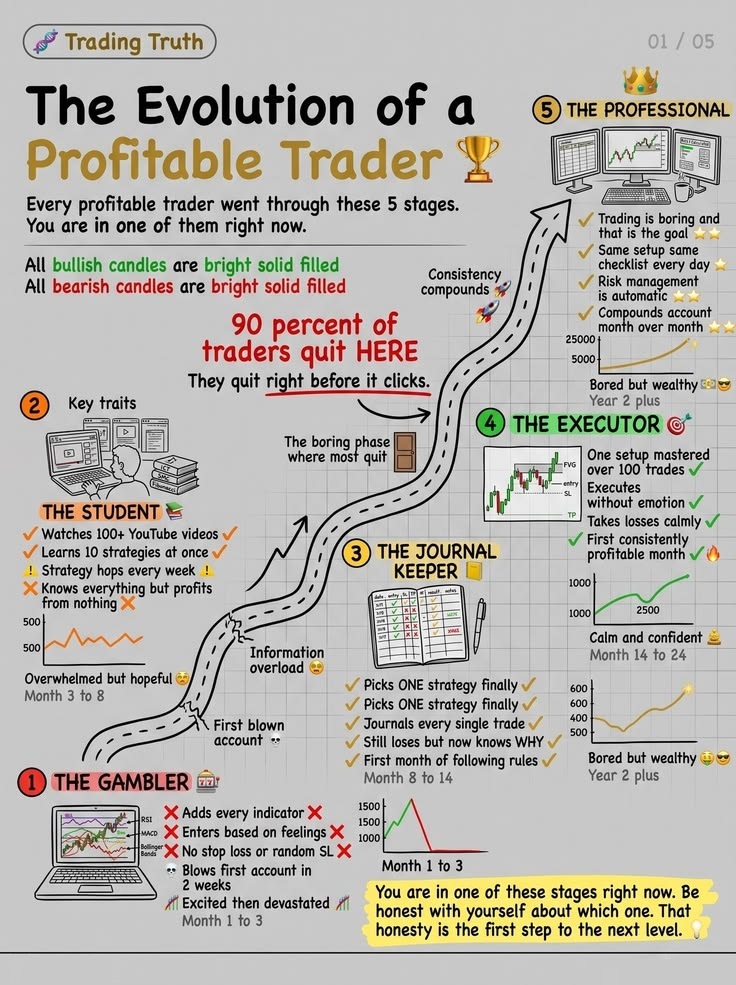
🟢QUALITY OVER QUANTITY - NO RUSH NO HURRY " WAIT FOR A+ SETUPS
🟥Most traders lose because they can’t wait.
They want the next trade more than the next opportunity.
Here’s the truth 👇
1⃣The market doesn’t reward urgency. It rewards patience.
2⃣Great setups come when 90% of traders are bored.
3⃣If you feel pressure to trade — don’t. That’s emotion, not structure.
4⃣Real pros spend 90% of their time waiting and 10% executing.
5⃣The waiting phase is part of your edge — not a delay.
When you can sit still while others chase noise, you’re already ahead.
Flow by Mihaly Csikszentmihalyi is the only book on performance psychology you need.
Every other book about 'the zone' or 'peak states' is just repackaging this.
30 years of research. 10,000+ interviews.
Here are 10 best quotes:
Energy is building below the ⚓️VWAP (sketched in) from the ATH in $ALAB
The more times any level of resistance is tested, the more likely it is to break higher.
Buyers are becoming more aggressive price wise (indicated by the higher lows) and time wise (more frequent tests of resistance.)
Keep a close eye on it
chart from @marketsurge
Qullamaggie on Darvas Figured Out the Secret to Big Winners
“And that’s what Darvas did too. He figured out early that the best way to find big winners, is to wait for a stock to double. Because a stock that’s going to go up 1,000% has to double first. Think about it.
He built a trading methodology around that concept: fast-growing stocks in new emerging industries that had already doubled.
It’s genius, it’s amazing. He figured it out 50 years ago.”
One is a vaccine for your cognitive system; the other for your affective system. When taken in tandem, they offer full inoculation against lobotomized degeneracy with zero side effects. Pre-order Suicidal Empathy now!
Position sizing should change with volatility.
Stock A: Moves 2% daily on average. Your stop loss is 4% away.
Stock B: Moves 8% daily on average. Your stop loss is 4% away.
Same stop loss percentage. But completely different risk.
Stock B is 4x more volatile. Your 4% stop loss will get hit more often just from normal movement.
Here's the fix:
Volatile stock = smaller position size
Stable stock = can take normal position size
Both risk the same rupee amount, but account for how much the stock actually moves.
Example:
- Stock A (low volatility): 200 shares
- Stock B (high volatility): 80 shares
Both risk ₹2,000 if stop loss hits.
But Stock B won't shake you out with normal volatility.
Most traders use the same position size for every stock.
Then wonder why volatile stocks always stop them out.
Adjust for volatility. It's not optional.
#Trading
This is what sector alignment looks like in real time.
Multiple defense stocks setting up together wasn’t random, it was the market hinting at strength beneath the surface.
This kind of alignment shows up again and again before major moves. Study it. It’s one of the clearest signals the market offers in advance.