2025 was "The Year of the Glut" but paper (virtual) barrels kept oil prices from falling. 2026 is "The Year of the Squeeze" but paper barrels keep prices from rising.
See below why financial oil flows are still more balanced than physical.
https://t.co/g9jJn1a5HQ
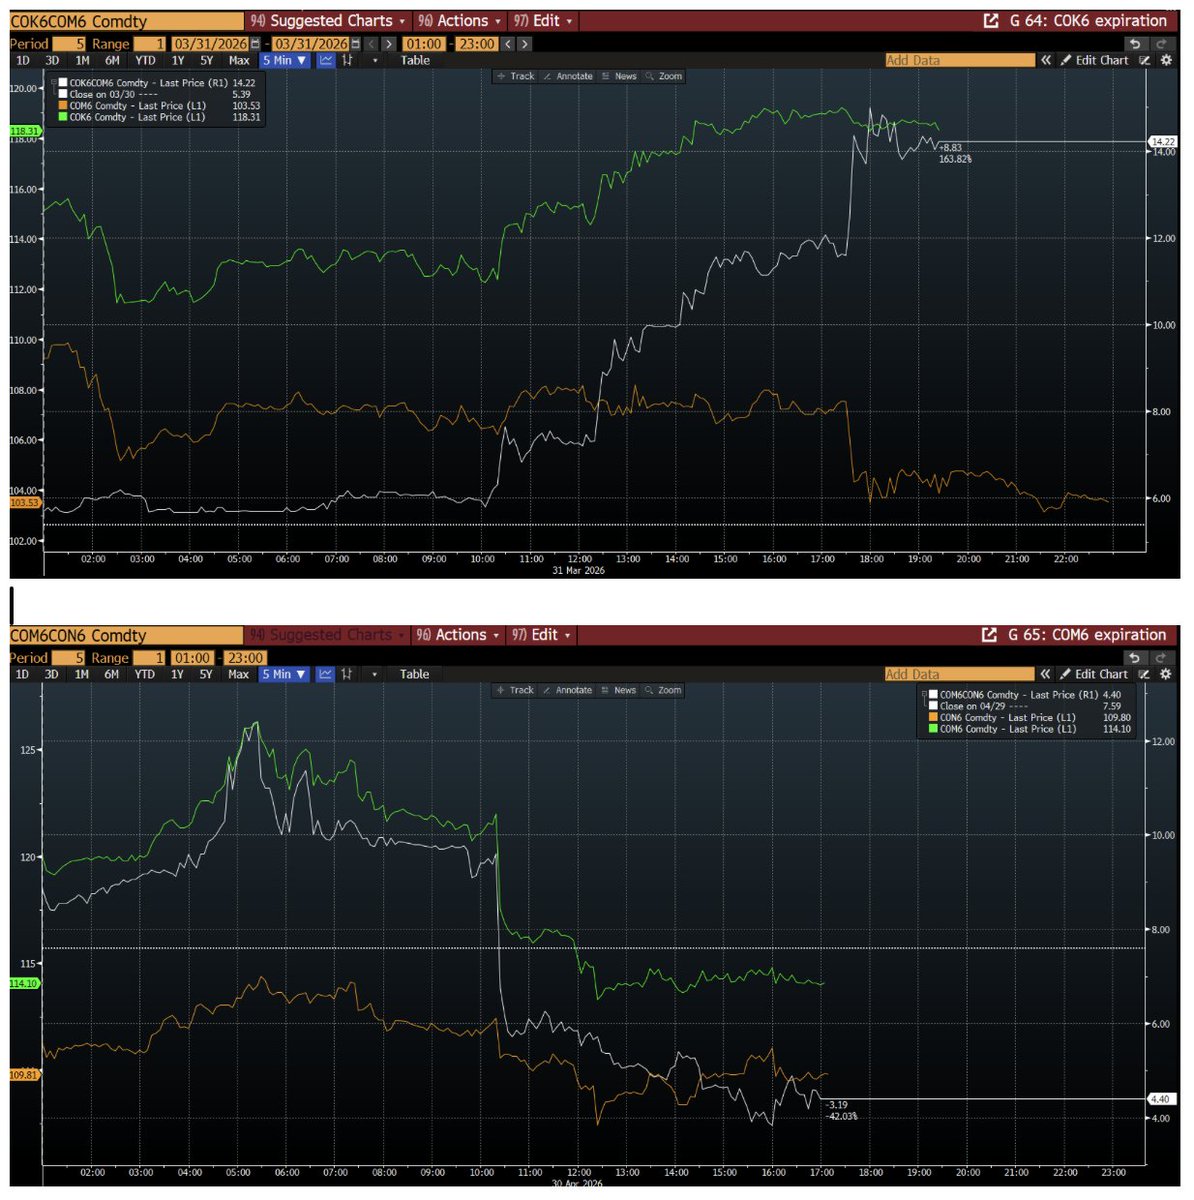
WHY DID BRENT DROP TODAY? BRENT JUNE (COM6) FUTURE EXPIRY
I see many people citing "June future expiration" as the reason for today's price drop without clarifying further.
They may find it interesting that exactly the opposite happened on the expiration of the previous - May 2026 future (on March 31st).
On the 2 graphs below:
- green line is expiring contract (May 26 on the top one, June 26 on the bottom one)
- white line is the front spread (May/June for the top and May/June for the bottom)
- orange line is 2nd futures contract (June 26 on the top, July 26 on the bottom).
Brent futures settlement is based on "Brent Index".
Full description is in the document below
https://t.co/XsFY3udeIv
But in broad terms the way the future settles is calculated by averaging 5 observations (volume weighted minute markers) - 2-3 minute periods around 10.30 , 12.30, 14.30, 16.30, 19.30 GMT/BST
AND 3 computation methods.
First two methods are based on the 2nd future contract (so this is what is averaged in the minute markers) and the third - on actual physical cargo trades - for the "First month" (i.e. the month of expiring contract - June 2026 today). There is also EFP involved, but it is a very small piece, so let us ignore it.
This is important - the 2nd future contract plays the key role in settlement of the 1st contract on expiry.
In the first two methods the value for the expiring future (June today) is implied by adding the front spread (June/July today) to the 2nd future (July).
This is the Cash BFOETM (Brent/Forties/Oseberg/Ekofisk/Troll/WTI Midland) front month to second month spread.
I described briefly the cash BFOETM forward in my note on Dated Brent below -
https://t.co/faEDaapUNB
... Normally cash BFOETM is close to the futures price for the same month; however it may not hold when the contract is expiring.
So if we go back to the graphs, we see that on expiry of May contract on 31st of March, 2nd contract (June 2026, i.e. COM6) was stable until 5.30pm (around 107).
But the spread between 2 contracts started to explode after the first sampling period reaching $12 by 5.30pm.
At the end of the day (17.30-19.30) COM6 dropped - so the spread with expiring COK6 increased further (since COK6 was 80% fixed at that time).
Today the spread behaved in exactly the opposite way - it was very high before the first fixing ($9-12, although $12 was reached - it seems - during some liquidation at night time), then dropped to $6 and is not around $4.
So what was going on - why did Brent drop today?
I am not sure :), but I would decompose the problem into 2 parts
1) why did July (2nd contract - CON6) drop
I like the theory linking it to yen carry trade unwind, suggested by @CRUDEOIL231, who I again strongly recommend to follow:
https://t.co/W3UQNsI72y
2)Why did the spread between June and July drop instead of going up like on previous expiry? I do not have a definitive answer, however here are some considerations
- At the end of March physical market was getting stronger and stronger, with physical premiums ultimately reaching as much as $23+ for certain BFOETM grades during the first and 2nd week of April.
So clearly there was strong demand for physical + as @OilCfd pointed out - it is quite possible that traders pushed the premiums higher in the Dated Brent window, similar to what reportedly happened with Dubai crude in March, when Total bought record amount of physical cargoes, achieving mind blowing physical fixings (allegedly making money on the derivatives, that were linked to those fixings).
This time around Dated Brent premiums were weaker and were weakening for last couple of weeks - due to more WTI Midland coming from the US and Chinese buyers reselling the cargoes that they bought in March (possibly expecting to get crude from SPR) - again thanks to for color.
I myself - after seeing what happened with June contract was thinking to take by June positions into expiry, but as the futures (COM6CON6) spread went above $7, while Dated Brent was not as strong as a month ago, decided not to bother and just rolled them into July ....
I could be wrong - as I do not trade physical oil (although I learned quite a bit about it and briefly oversaw a small physical business a few years ago and have friends in the industry) - so if any actual physical traders care to chime in, it would be great.
Aylık Türkiye Enerji Verileri Ocak 2026 yayınlandı. Excel, sunum destesi hepsi ücretsiz.
Bu ayki ana odak, büyüme göstergeleri
@WEC_Turkiye 'ye teşekkürlerimle
https://t.co/gOYPmdVELh
Bugün Ankara'da Enerji ve Tabii Kaynaklar Bakanı Alparslan Bayraktar'ı makamında ziyaret ettik, elektrikli araç ekosistemiyle alakalı hoş bir sohbet gerçekleştirdik. Belki elektrikli araç dönüşümünün altyapıya etkisi ve enerji depolama sistemlerinin yaygınlaşması konusunda bir söyleşi için de davet ettik.
Elektrifikasyon konusunda farkındalık oluşturmak için çalışmaya devam.
Do It Yourself-DIY Energy Outlook
There are numerous energy outlooks, why don't you build another one?
A simple Excel file, change 2 parameters and see how it shapes the energy outlook
#oott
https://t.co/Qhxl4HGg1a
Basit bir Küresel Enerji Modelleri
Sadece 2 parametre ile emisyonlara, elektrik talebine kendi gelecek görünümünüzü oluşturabilirsiniz
Excel: https://t.co/CH4SNXX3qt
PDF: https://t.co/reA2XM6JaO
Github: https://t.co/9LezYR0YQN
Aylık Türkiye Enerji Verileri - Haziran @WEC_Turkiye'de yayınlandı
Öne çıkanlar https://t.co/yFImNnDmIf
Sunum Destesi - Türkiye'nin tüm enerji kaynaklarının aylık gelişimi https://t.co/eoIISHtQV9
Excel veri dosyası - https://t.co/f9faT9k4C0
Dünya Kömür Talebi nereye gider? Mustafa Aslan'ın bu konudaki çalışması Türkiyede bir ilk,kodları açık.Politik değil ekonomik senaryo
3 senaryo ekseninde kömür talebinin en fazla yavaşlaması gerçekçe
1. NetSıfır
2.Olağanakış
3. Yüksek Gaz Fiyatları
https://t.co/WLqAeaY5I2 #coal
.@aramco CEO: we are looking at oil demand average of 104.5 million b/d this year. Q4, we're looking at close to 106 million b/d. We are anticipating an oil demand growth of about 1.5 million b/d next year #OOTT#FII2024
We are excited to introduce our new podcast 'What's Hot in Energy'!
Our first episode, 'Oil Demand Growth: Why so much confusion?' is available to listen to now by clicking here https://t.co/6MdibTyHaZ
#oil#energy#podcast#OOTT#OilDemand
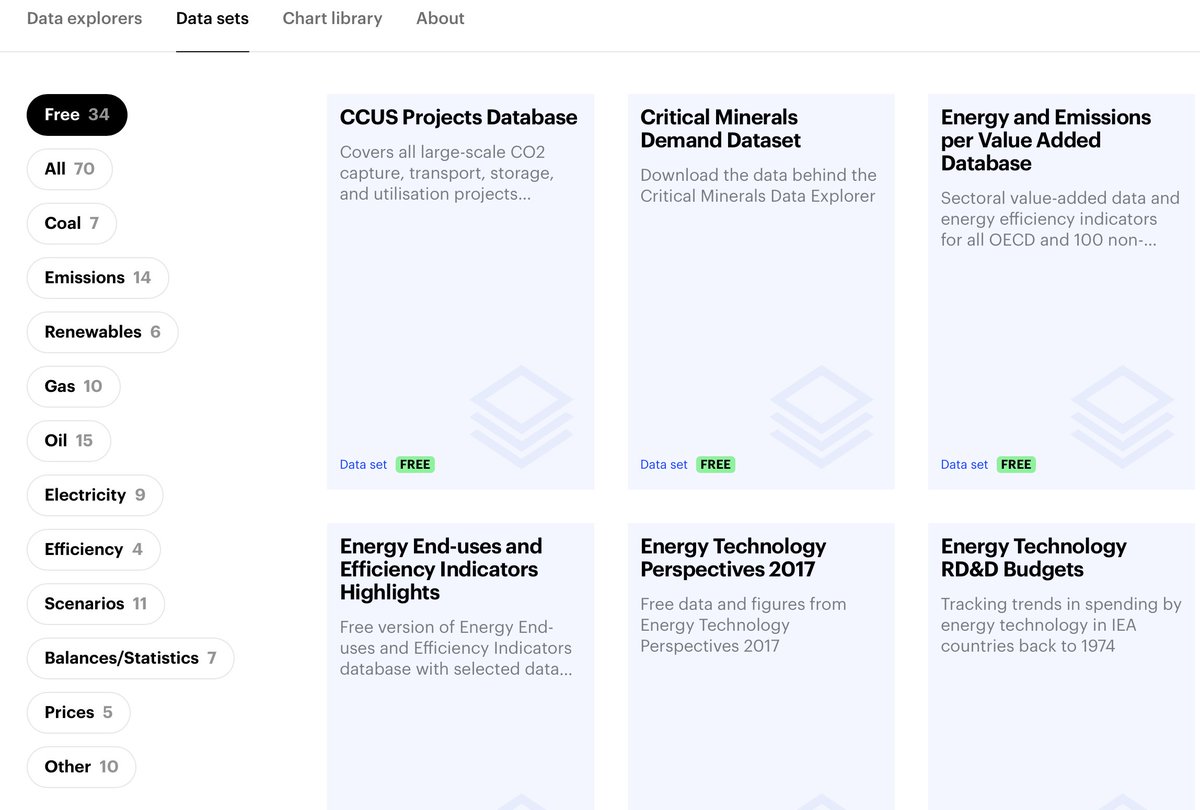
Enerjide en çok ücretsiz veri yayınlayan kurumlardan olan Uluslararası Enerji Ajansı (@IEA)'in
* 34 ayrı veri seti
* 4928 grafik (ve veri setleri CSV)'ye ücretsiz erişebiliyorsunuz
https://t.co/UcfRxv4VQx
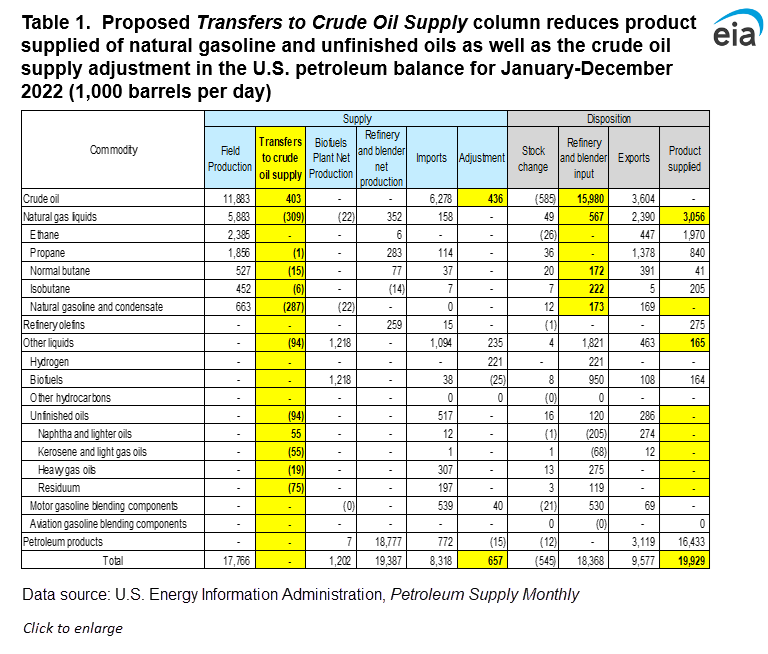
EIA ADJUSTMENT: IMPLICATIONS FOR US OIL DEMAND. #OOTT
If you are following US petroleum statistics you have certainly heard about EIA adjustment - it it the difference between refinery input and the sum of US crude production, net imports and net inventory change.
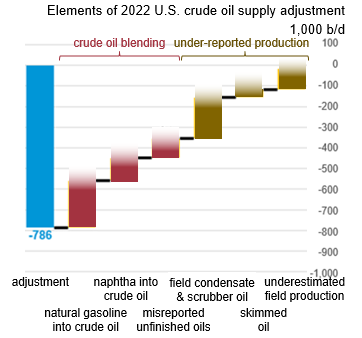
Most recently this difference has been consistently positive (i.e. refinery input is larger than the sum of other parts): on average 786 kbd in 2022 and 707 kbd in 2023 - not small amounts (these are the numbers from a more precise EIA *Monthly* report).
EIA did an investigation and provided a detailed breakdown of adjustment. I will give a link to the thread from the head of EIA and an article in comments.
Their explanation was that approximately 40% of adjustment is effectively underreported production (only a small part of it - 100kbd - is actual crude, the rest is condensate and other stuff, which nevertheless enters crude stream - so my view is that we should account for it as crude). See the picture below.
Another 60% are circa 400kbd NGLs (primarily natural gasoline) and Other Oils, which get blended into crude.
Here is what happens: EIA reports those NGLs as "Products Supplied" - i.e. part of final petroleum demand. But they are rarely end use products - rather they get blended into crude.
It creates two mismatches:
1) what is exported as crude is in reality crude + some of these NGLs blended in (and exports statistics accounts for it as all crude - thereby overstating pure crude exports)
2) input to refineries is a mix of crude and those NGLs (and again the stats do not account for it) - this is why there is a positive difference.
EIA proposed to solve this problem of blended NGLs/Other Oils by creating a column "transfers to crude supply" - see the table below.
But, what it means for oil demand is that those 403kbd should (in my view) be taken out of Total Petroleum Demand (= Products supplied), which is 20.3mbd for US in 2022. Since they are not demand - they just get recycled back and blended into crude.
So the true number should be 19.9 mbd, and since this effect is recent and has to do with US shale/export growth it means that the trend for US demand is a bit worse than what statistics shows.
PS I am still a long-term optimist on world oil demand and think it is mainly about non-OECD ex China and perhaps a bit about China - so US demand trend is not of primary significants. But it is important to track those things to have an informed view.