🚨 BREAKING
THE FED WILL INJECT $2,122,000,000.00 INTO THE MARKETS TOMORROW AT 9:00 AM ET, MINUTES BEFORE THE U.S. MARKET OPENS.
KEVIN WARSH JUST ORDERED THE FED TO START PRINTING TO PREVENT A HUGE CRASH CAUSED BY THE SEPTEMBER RATE HIKE!
THIS IS ONLY THE FIRST INJECTION - THE FULL PLAN WILL BE PUBLISHED BY THE NEW YORK FED.
THIS ISN'T STANDARD POLICY - THIS IS A RESCUE OPERATION!
THE MESSAGE IS CLEAR: THE FED IS ALREADY PREPARING FOR SERIOUS MARKET STRESS AROUND THE SEPTEMBER RATE HIKE!👀
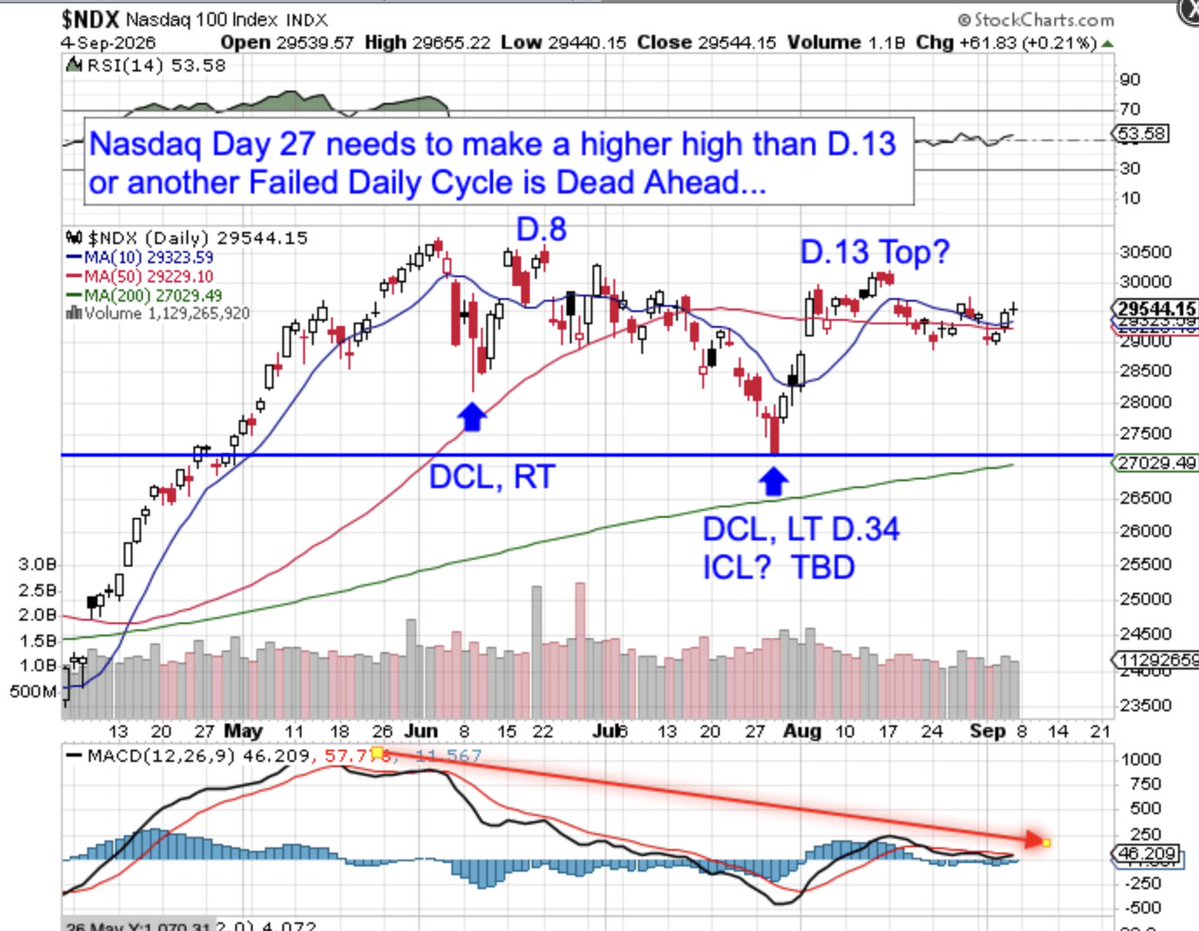
#StockInFocus Nasdaq is at a key Cycle decision point and needs to make a higher Cycle high soon or another drop is likely... Early Cycle tops can lead to nasty drops $QQQ $QQQM $SQQQ
#Gold needs a robust close above its 10dma to move higher. Failure to do so will have price re-testing the early Sept low by mid-month. $PHYS $GLD $UGLD $PSLV
Read the note on the 5-min chart, that I sent out to all Subs in the mid-week update. In brief, the decline waves look "corrective", which means higher high ahead. My conclusion, "so, I am cautious of any bearish bet now."
The opening low is 7627, lower than the previous lows near 7640.
The second part of my prediction is right [break the previous lows within two trading days].
Now, the next step is to fill the GAP at 7600.
The U.S. 10 Year Yield is breaking out and making new 1.5 year highs despite the U.S. Treasury doubling its bond buyback program.
This is bad for stocks.
Narrative: Billions of barrels of Venezuelan oil will bring oil prices down
Reality: It'll take a few years to start getting it out in volume. It's poor quality, thick, tar-like and contaminated, so needs intensive, expensive refining.
Result: We need MUCH higher oil prices in this inflationary environment to make it economically viable.
Do you see how this works now? Ignore fairytale narratives...simply observe the chart - it literally tells you what the market participants know.
MPW Bamboo Scroll #239 Posted: (1) $NVDA earning & Walsh speech did what I laid out in #238 scroll "fake-moves to shake off both bulls and bears." (2) now, after the disguise move, the real deal would take place next Monday & next week. (3) details here https://t.co/pVu5UHv0Ar
MPW Mid-week Update Posted: (1) my $NVDA pattern has panned out, once again--as post-earning, it has already touched my 218 target marked on the chart. (2) hope you caught this fish, and the next BIG ONE. Check here for the setup at: https://t.co/pVu5UHv0Ar
The bottom window is the 50 day average of the up down volume for $GDX. Reading above “0” show that GDX is in an uptrend (shaded in blue) and readings below “0” and down trend (shaded in pink). Current reading on this indicator is +6.48 showing that GDX is in an uptrend. There is another important aspect on this chart. When this indicator is coming off a low, its ideal for it to reach +20 or higher (showing initiation of an uptrend); suggesting a strong uptrend is beginning. We noted past examples of the 50 day average of the up down volume reaching +20 coming off a low with blue dotted lines; the last three times the rally lasted form 8 months to 1 year. Like to see the current rally continue and push the 50 day average of the up down volume to reach +20 or higher.
SPX is still playing with SMA[20], now sitting at 7668.
No decisive move yet--and I have a feeling that the first 1% move will be a trap, either up or down.
From $NVDA's pre-earning reaction so far, the script for SPX looks like, 7620, then 7720, then THE BIG BANG.
🚨 🇺🇸 BESSENT JUST CALLED A MONDAY PRESS CONFERENCE AS THE U.S. BOND MARKET STARTS BREAKING AGAIN
The Treasury Secretary will address the public at 2:00 pm ET.
The timing is fucking insane.
The 30-year U.S. Treasury yield just hit 5.34%. Highest level since 2007.
Washington responded by doubling long-bond buybacks, from $2 billion to at least $4 billion per operation.
Yields dropped immediately.
But within one day most of that move was erased, and the 30-year was back near its peak.
Bessent has already said the buybacks could be increased even further.
U.S. debt is now above $40 trillion, and the cost of financing it keeps rising.
The Treasury is trying to calm a bond sell-off that refuses to stay down.
This announcement will move the entire market.
Be ready.
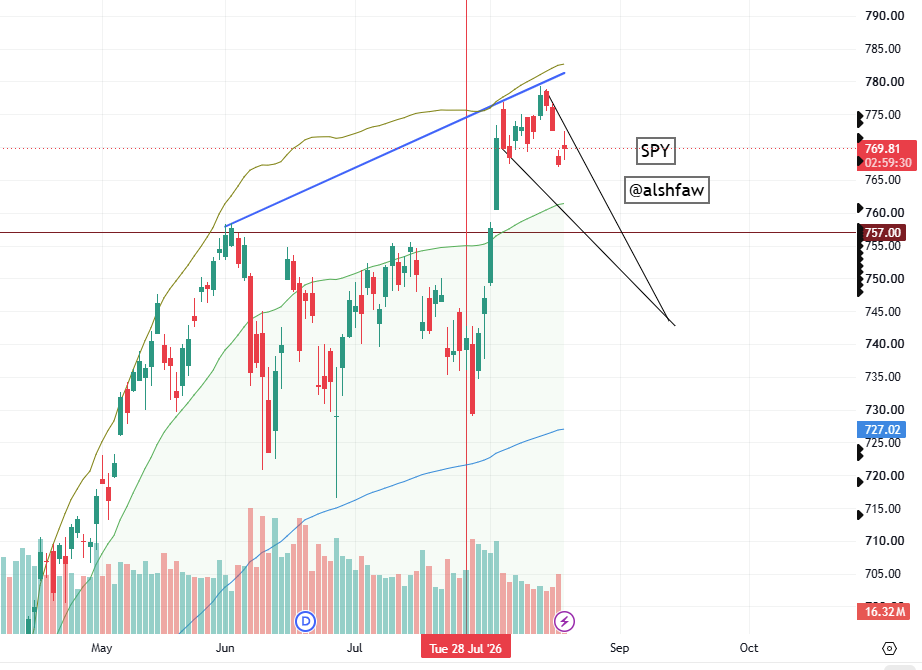
$SPY the Path Into 9/11 Is Clear. See picture.
- This was also confirmed on the Dow Jones yesterday, see previous post.
- Today's @SecScottBessent Kabuki theater was to close the gap on the SPY, a 50% FIB retrace on the recent drop. Will continue down.
- Follow the wedge down wall-to-wall until completion. A wedge can resolve before the apex is reached.
- This is the current setup. Geometry is on the side of the bears.
Share & Subscribe, <link in bio>.
$SPY $QQQ $IWM $MDY $RUT $DIA $SDOW $SOXX $SOXS $SMH $NVDA $TSLA $YINN $VIX $VXX $TLT $BTC $GLD $SLV $SVXY $DRAM $SNDK $MU $EWJ $EWY
🚨 THIS JAPANESE TRADER IS WAITING TO PULL THE TRIGGER AGAIN 🇯🇵
Almost nobody is paying attention to what he’s setting up.
He shorted $GOLD near $4,500 → covered around $4,000.
Then immediately flipped LONG at $4,000 → sold near $4,400.
Now he’s sitting on his hands.
Because his next trade could be much bigger.
He’s waiting to load massive positions in $GOLD and $SILVER - and his exact entry levels are already marked on the chart.
And this isn’t some random X account throwing out predictions.
Last cycle, he bought $ETH around $90 and eventually exited near $4,000.
Even Binance founder CZ follows him.
I’m watching his levels like a hawk.
If Gold and Silver fall into those zones, I want this chart saved before everyone suddenly starts talking about him.
Bookmark it.
First red-alert for my 2-hr TOP KILLER SIGNAL since June 2nd this year.
Opened SPY 8/19 puts [777] at the open. Will add more if new ATH reached later today. Will hold them till expire or at least 2-3 bagger. NTA.





![MasterPandaWu's tweet photo. The opening low is 7627, lower than the previous lows near 7640.
The second part of my prediction is right [break the previous lows within two trading days].
Now, the next step is to fill the GAP at 7600. https://t.co/nhawjcIVd4](https://pbs.twimg.com/media/HRIsZ3gXMAAhiHn.jpg)


![MasterPandaWu's tweet photo. SPX is still playing with SMA[20], now sitting at 7668.
No decisive move yet--and I have a feeling that the first 1% move will be a trap, either up or down.
From $NVDA's pre-earning reaction so far, the script for SPX looks like, 7620, then 7720, then THE BIG BANG. https://t.co/1bMk9GDdMI](https://pbs.twimg.com/media/HQlj8tUWYAAEbeW.jpg)