Have you explored @CentreforCities' Cost of living tracker? We have collated the latest on:
📈 City-by-city inflation figures
💼 Wages data
💷 Spending data on essentials
💡 City-by-city average energy bills
#CostOfLivingCrisis
https://t.co/NHntuRK3t7
@onenottingham 4 of 5 big retail sectors strengthened in 2022. YTD sales vs 2019 for Fashion went from -17% in Q1 to -11%. Health & Beauty went from -13% to -8%, Groceries grew from +1% to +11% and Food & Drink grew from +20% to +23%. General Retail continues to suffer at -23%.
@onenottingham 4 of 5 big retail sectors strengthened in 2022. YTD sales vs 2019 for Fashion went from -17% in Q1 to -11%. Health & Beauty went from -13% to -8%, Groceries grew from +1% to +11% and Food & Drink grew from +20% to +23%. General Retail continues to suffer at -23%.
🏠 Households across the UK are tightening their belts as the #CostOfLivingCrisis continues to bite.
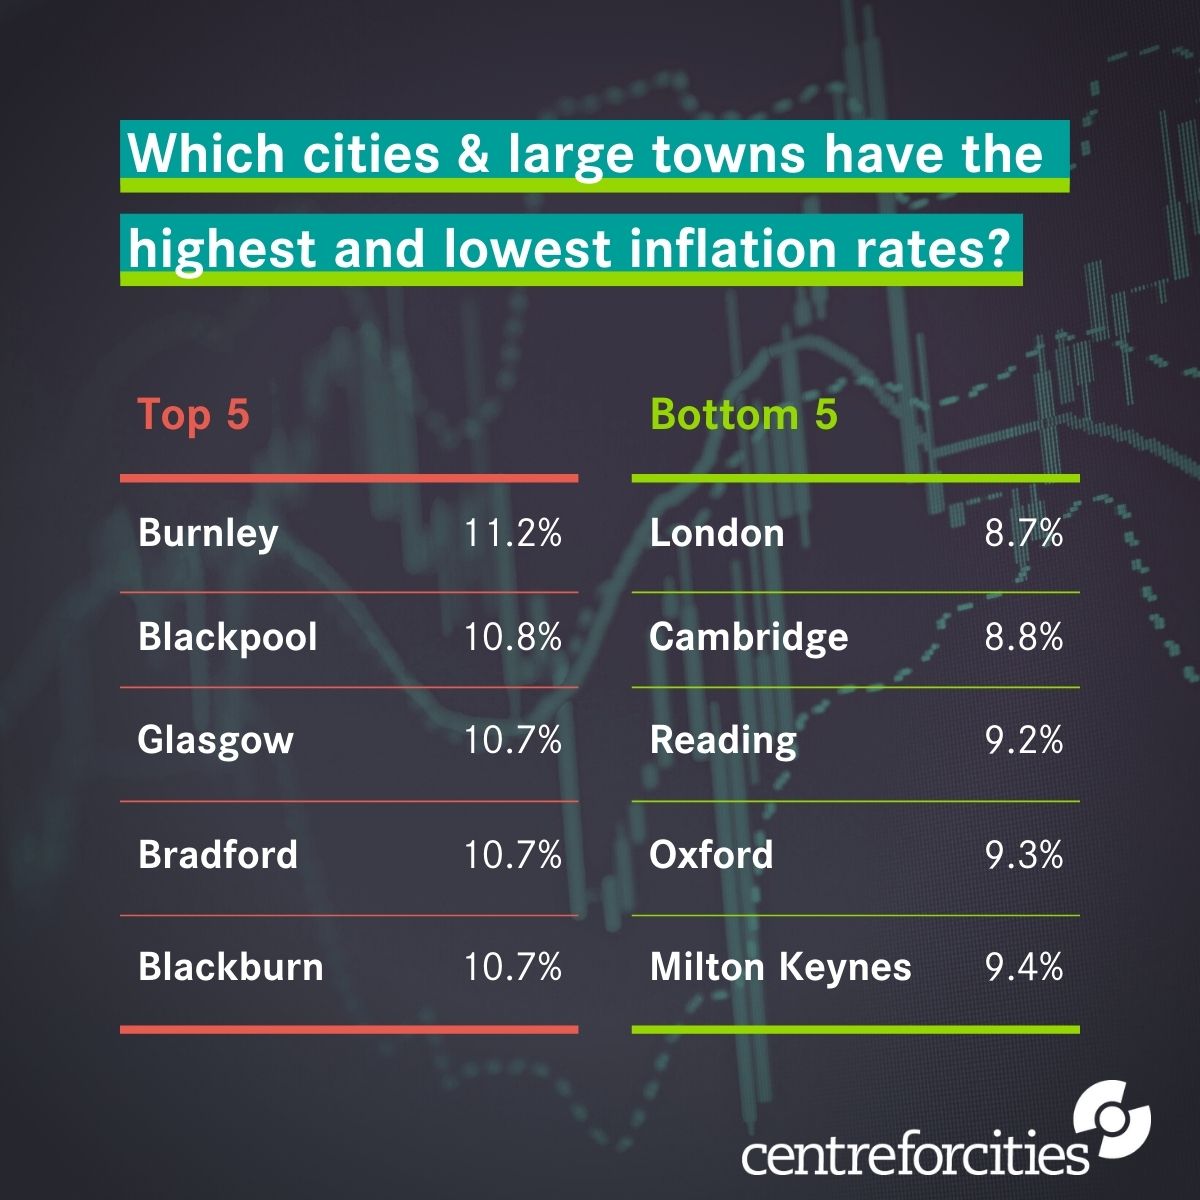
But some places are experiencing higher inflation rates than others.
Visit @CentreforCities tracker for the latest data:
https://t.co/NHntuRJvDz
Although retail sales in Nottingham City Centre are down on 2019, they have strengthened in recent months. YTD sales have increased from -7% in Q1 to -2%. Strengthening sales were driven by increased customer numbers. @NottinghamBID@MyNottingham
YTD sales in Leicester city centre are flat compared to 2019 despite a 4% increase in customer numbers. Fashion, General Retail and Health & Beauty are suffering with YTD sales at -15%, -30% and -20% compared to 2019. Food & Drink and Grocery are both at +17%. @BIDLeicester
YTD sales in Leicester city centre are flat compared to 2019 despite a 4% increase in customer numbers. Fashion, General Retail and Health & Beauty are suffering with YTD sales at -15%, -30% and -20% compared to 2019. Food & Drink and Grocery are both at +17%. @BIDLeicester
📊🔎 We've crunched the latest data to understand in greater detail how the cost of living crisis is playing out at the local level.
Visit the link below to explore the latest data for your city or large town:
https://t.co/NHntuRJvDz
⚠️ New data added to our #CostOfLiving tracker ⚠️
The national inflation figure sits at 10.1%.
But how is the cost of living playing out geographically?
In July, our 'Out of pocket' report found that when it comes to inflation and cost of living, not everywhere is in the same boat. As energy consumption rises for the winter, join us on Tuesday 18th to explore the uneven geography of the crisis.
Register: https://t.co/oIT0Ker2mu
🔎 Looking at August 2022 data, it's clear that the geography of the cost of living crisis persists, with many of the hardest-hit places in the North.
Explore all our work on the #CostOfLivingCrisis and keep an eye out for our next data update here 👇
https://t.co/n9XGvDPxJ1
Beauclair provides data to @CentreforCities on local energy cost inflation in 62 cities as reported in this story. Cost-of-living crisis: Which UK cities are the most worried – mapped | UK | News | https://t.co/v2MfqFysYB https://t.co/OMIgRrAK4J
@CentreforCities is making really smart use of our data to show how the cost of living crisis is hitting some cities harder than others. Lower energy efficiency of housing means that the energy price cap does not solve this problem https://t.co/1mvprUQZAy
The UK is in the grips of a #CostOfLivingCrisis with households up and down the country having to choose between food, fuel and heating.
👉Access the latest credit & debit spend data on essentials for the UK's 62 cities and largest towns via our tracker:
https://t.co/NHntuRJvDz
August retail data highlights - Beauclair - Travel & Accommodation was the only sector with improved monthly sales in August https://t.co/0b01LtUX8o