@jeffdavismd@urko_garmendia@claudeai Software or statistical work related to public health / epidemiology gets downgraded every time. I’ve also noticed it sometimes keeps the main agent on Fable but silently downgrades the subagents, and reading their reasoning is the only way to catch it.
According to the NDDoH COVID-19 Dashboard for the week of December 26:
• Active cases are 3.5x higher among those not fully vaccinated against COVID-19 than the fully vaccinated
• Active hospitalizations are 5.1x higher among those not fully vaccinated than the fully vaccinated
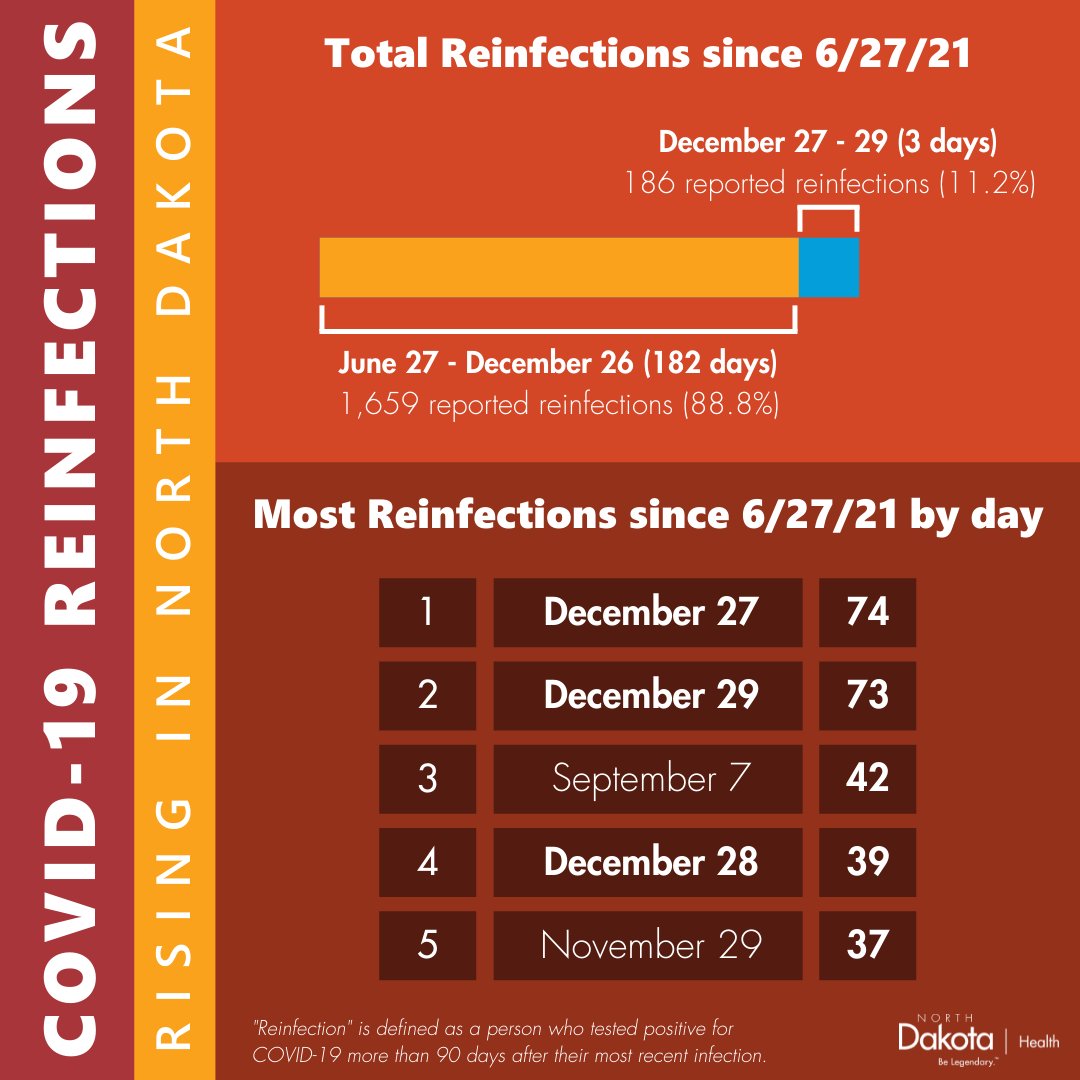
ND has seen a sharp increase in COVID-19 reinfections: over 11% of all reinfections have been reported since Sunday. On average, these reinfections are 370-400 days from primary infection but can occur in as few as 90 days.
Find COVID-19 vaccine: https://t.co/CfSHcqwAnF
If all COVID-19 deaths in the U.S. happened within a 61-mile radius of Bismarck, no one would be left alive.
An eye-opening, somber simulation of COVID-19 deaths. Sometimes I get caught up in the numbers too much, so it's good to get a dose of perspective every so often.
Late this past week, the COVID Tracking Project & Johns Hopkins University adjusted how the ND COVID-19 positivity rate was being reported nationally after discussions with NDDoH and ND Unified Command. NDDoH epidemiologist Ben Schram is here to break down what that change means:
Grateful for Team ND experts who worked with @COVID19Tracking and @JohnsHopkins to help them accurately represent our robust ND testing. With our full dataset now included, ND’s positivity rate on these sites is finally consistent with our @NDDOH reporting.
There’s been a lot made of the fact that North Dakota is leading the nation in new COVID-19 cases per capita. I talked to two epidemiologists to put it in context. I’m interested in what my stats people think on this topic. https://t.co/FNYQaisyQw