Imagine figuring out trading, getting rich, and never going broke ever again. For the rest of your life.
That’s you bro. It’s only a matter of time.
Claim it.
The options trading day just got longer 👀
Trade options 7:30–9:25am and 9:30am–4:15pm ET on SPY, QQQ, and IWM. More symbols like TSLA and NVDA are on the way.
BREAKING: The New York Stock Exchange just launched extended-hours options trading, per CNBC.
It covers 29 big stocks and ETFs, including Nvidia, $NVDA, Bank of America, $BAC, $SPY and $IWM.
Starting Dec. 6, those names will trade 23 hours a day, five days a week.
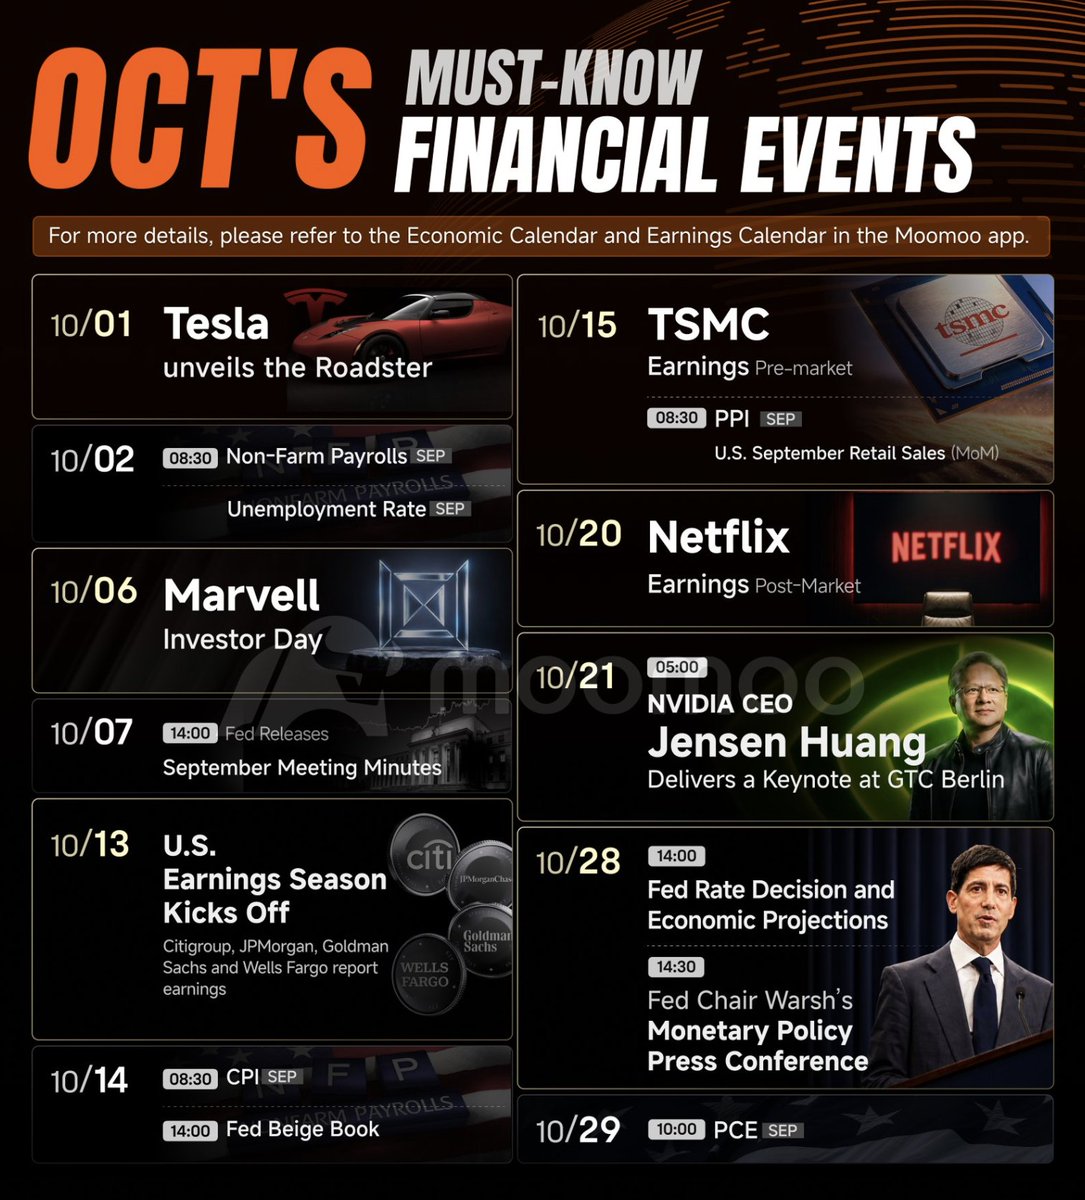
October is loaded with catalysts.
We’ve got $TSLA Roadster, jobs data, $MRVL Investor Day, Fed minutes, CPI, PPI, $TSM and $NFLX earnings, Jensen at GTC Berlin, another Fed decision and PCE to close out the month.
A lot of potential market-moving events packed into one month.
Bookmark to keep this calendar handy.
The crypto bull run is here.
The traders who leverage AI are about to make a sh*t ton of cash...
Paste this prompt into Claude to build your first AI trading bot.
Thank me later:
🚨 BREAKING: TradingView just made its biggest screening update in years.
You can now scan 3,500 stocks for your exact setup in seconds. No code. No paid tool required to start.
Most traders still check charts one by one 👇
Most of the buying and selling in SPX on a normal day is not you, me, or you Aunt Sally. It is dealers hedging delta. Since 0DTE went daily in 2022 that flow got bigger and faster. Here is how it works and why it keeps showing up on your chart.
Delta hedging explained 🧵
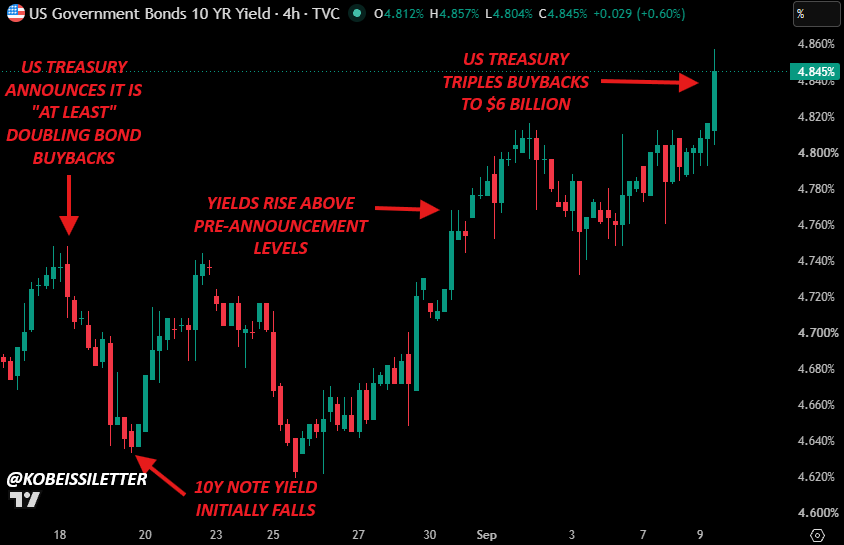
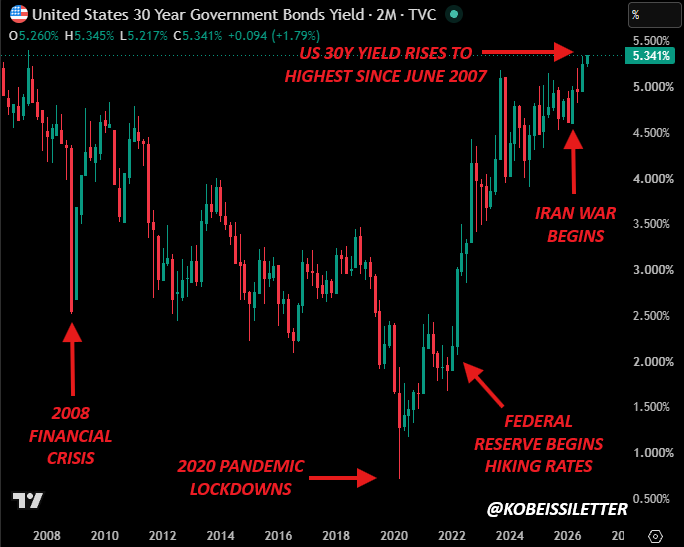
This has driven US borrowing costs to a fresh 30Y high.
As a result, the US Treasury announced that they are tripling long-term buybacks to $6 billion.
That means the US Treasury went from doubling, to "at least doubling," to tripling buybacks.
Yet, yields are still rising.
Talk about a turn of events.
Oil prices are back above $100, PPI inflation is up to +5.4%, and President Trump is preparing potential $5,000 "dividends."
Now, US long-term borrowing costs are up to their highest since June 2007.
What comes next? Let us explain.
(a thread)
In all fairness, US Treasury Secretary Bessent was already behind the 8-ball before he started.
The US is now running $2+ trillion deficits, spending over $1.2 trillion on annual interest expense, and fighting 60 consecutive months of 2%+ inflation.
On top of this, oil prices have nearly doubled since the Iran War began, inflation expectations are surging, and the Fed went from rate cuts to discussing rate hikes.
Taming the surge in yields is nearly impossible over the long-term, even for the US Treasury itself, without a structural shift in several of these fundamental drivers.
Simply put, "free money" is only "free" for so long, and the world cannot handle $100+ oil prices on top of compounding inflation.
As an investor, the only thing you can do is position yourself accordingly.
That's exactly what we are doing.
THIS IS F**KING DANGEROUS
I GAVE CLAUDE ACCESS TO OPTIONS FLOW, ORDER BOOK DATA, AND GAMMA WALLS — AND IT STARTED CALLING LEVELS BETTER THAN I DO
not a chart with two moving averages. not a “buy the dip” alert. this is a full institutional desk compressed into one AI session
here’s what’s on the screen right now:
→ GEXRadar pulling Gamma Exposure across 44 strikes in real time
→ Delta Exposure flipping between bars and candles showing where dealer hedging shifts
→ Major Walls: call wall at $700 with +276M, put wall at $691 with -97M
→ Hedging Pressure gauge sitting at 48/100 — neutral, dealer flow balanced
→ Net Drift tracking $19.93B in calls against $32.39B in puts — put dominated
→ IV Surface Analysis rotating in 3D showing where volatility is mispriced by strike and expiry
→ MotiveWave footprint printing every bid and ask at every price level, tick by tick
→ DOM ladder on MNQ futures with live bid/ask stacking — 29,103.75 ask, 29,103.50 bid
Claude reads all of it
not the chart — the structure underneath the chart
gamma exposure tells it where dealers are forced to buy or sell. delta exposure tells it which direction the hedging pressure is building. the wall map tells it where price stalls. the footprint tells it whether the move is real volume or just air
entry: 1 contract MNQ at 29,054.75
TP set: 29,178.25
P&L climbs → +$64 → +$146 → +$167
the trade wasn’t a guess. the call wall at $700 held, hedging pressure was neutral, gamma flip sat at $698, and the footprint confirmed buyers absorbing every offer at the 29,050 level
Claude saw the wall. saw the flow. saw the absorption. and said: this is the entry
tested this setup with $100 starting capital — ended the session at $3,153
that’s not leverage doing the work. that’s an AI reading options structure, order flow, and gamma positioning simultaneously — something no human can do across 44 strikes in real time
you’re still drawing trendlines
Claude is reading the market’s skeleton
save this — the full setup and session walkthrough is in the article below ↓
18 OUT OF 18.
Since 1954 The S&P 500 $SPY has been higher 12 months after every midterm.
That’s a 100% WIN RATE
Average gain: +18.2%.
With October historically producing the low.
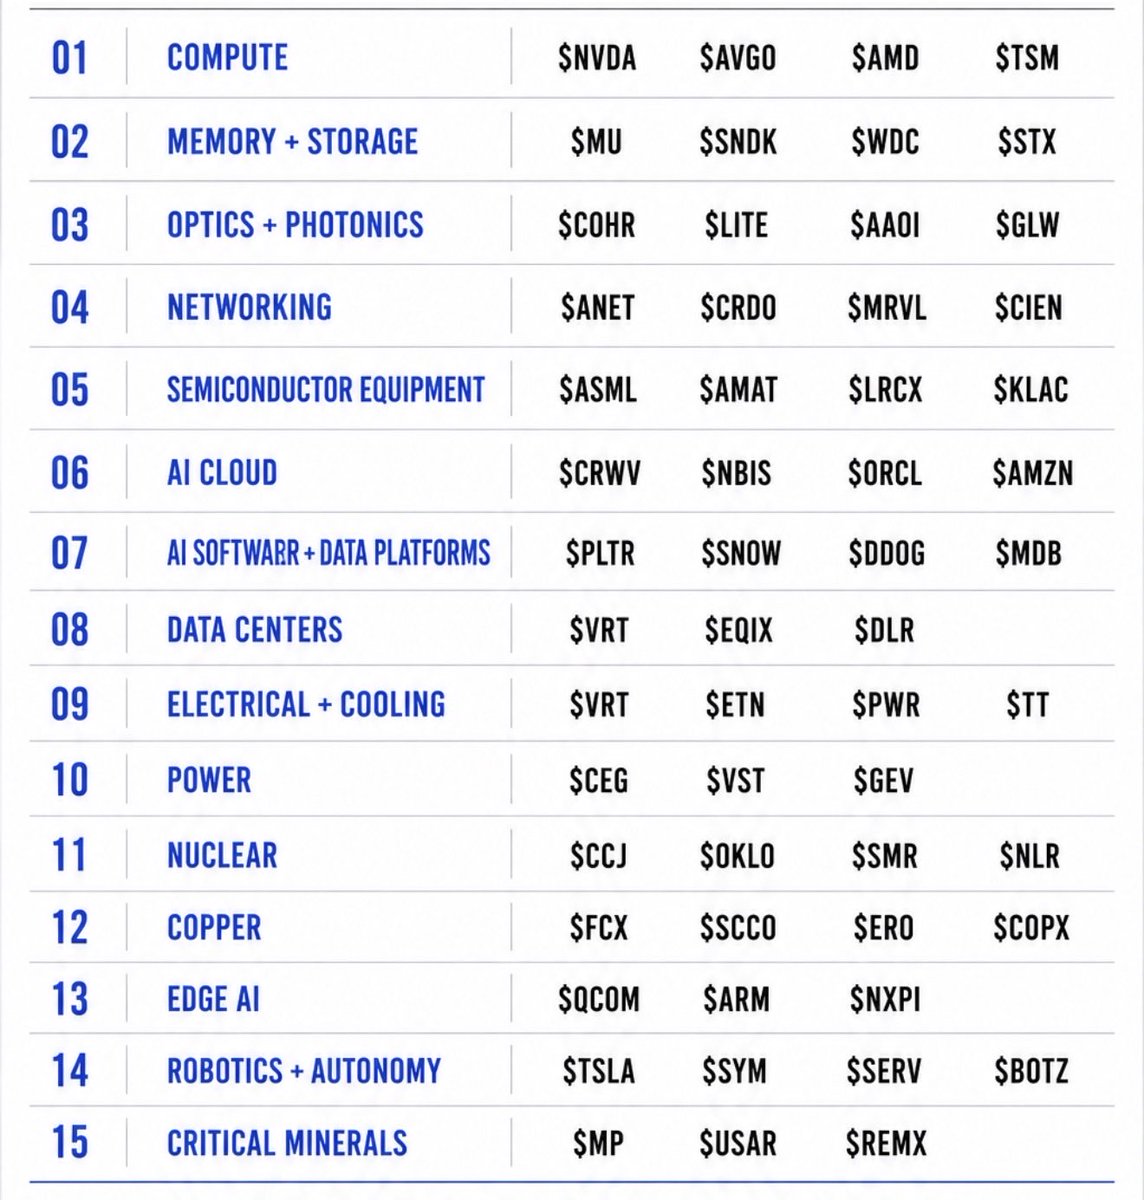
I’m not waiting until 2027 to build my AI watchlist.
So I’m already building my 2027 AI roadmap:
COMPUTE
$NVDA $AVGO $AMD $TSM
MEMORY + STORAGE
$MU $SNDK $WDC $STX
OPTICS + PHOTONICS
$COHR $LITE $AAOI $GLW
NETWORKING
$ANET $CRDO $MRVL
SEMICONDUCTOR EQUIPMENT
$ASML $AMAT $LRCX
AI CLOUD
$CRWV $NBIS $ORCL $AMZN
AI SOFTWARE + DATA
$PLTR $SNOW
DATA CENTERS
$VRT $EQIX $IREN
ELECTRICAL + COOLING
$VRT $ETN $PWR
POWER
$CEG $VST
NUCLEAR
$CCJ $OKLO $NLR
COPPER
$FCX $COPX
EDGE AI
$QCOM $ARM
ROBOTICS + AUTONOMY
$TSLA $SYM $SERV $BOTZ
CRITICAL MINERALS
$MP $USAR $REMX
Phase 2 starts next year the AI Cycle
Now watch what connects it, stores it, builds it, powers it, cools it and moves AI into the physical world.
Save this roadmap for 2027.
Gold miners relative to gold are on the verge of breaking out
To reach the previous cycle peak, gold miners would have to outperform the metal by ~3:1.
Meanwhile, gold miners are one of the most ignored yet most profitable sectors in the S&P.
They've spent more than a decade building a massive consolidation.
Breakouts from long consolidations can be very explosive.
As time progresses, I expect miners to vastly outperform gold.
🚨 BREAKING: TradingView just made its biggest move in years.
AI is now built into the charts you already use every day. Most swing traders have no idea it's there.
Here are 8 features that change how you find and manage trades 👇
If you have no clue how to implement AI in your trading, I highly recommend starting by connecting the TradingView MCP + Claude.
Once it's connected (2 mins), Claude can actually read your charts and act on real market data.
A few high-leverage ways to actually use it:
• Have Claude subagents manage your watchlist (notify you when trade setups occur)
• Build custom indicators based on your strategy (full Pine Script coding)
• Scan the TV community posts (super underrated use case - lots of alpha/setups being shared here daily)
For research, screening, etc., it's one of the easiest ways to start implementing AI in your daily trading.