Data scientist and full-time crypto trader since 2016. Daily $BTC threads that backtest what everyone believes so you trade what's real, not what's loud.
⏰ I just published my first official academic research paper on Bitcoin, live on SSRN. Completely free to read.
Titled "Bitcoin Runs on a Clock". A deep dive on the Bitcoin 4 year cycle.
Is it real, or have we just been fooling ourselves for 15 years?
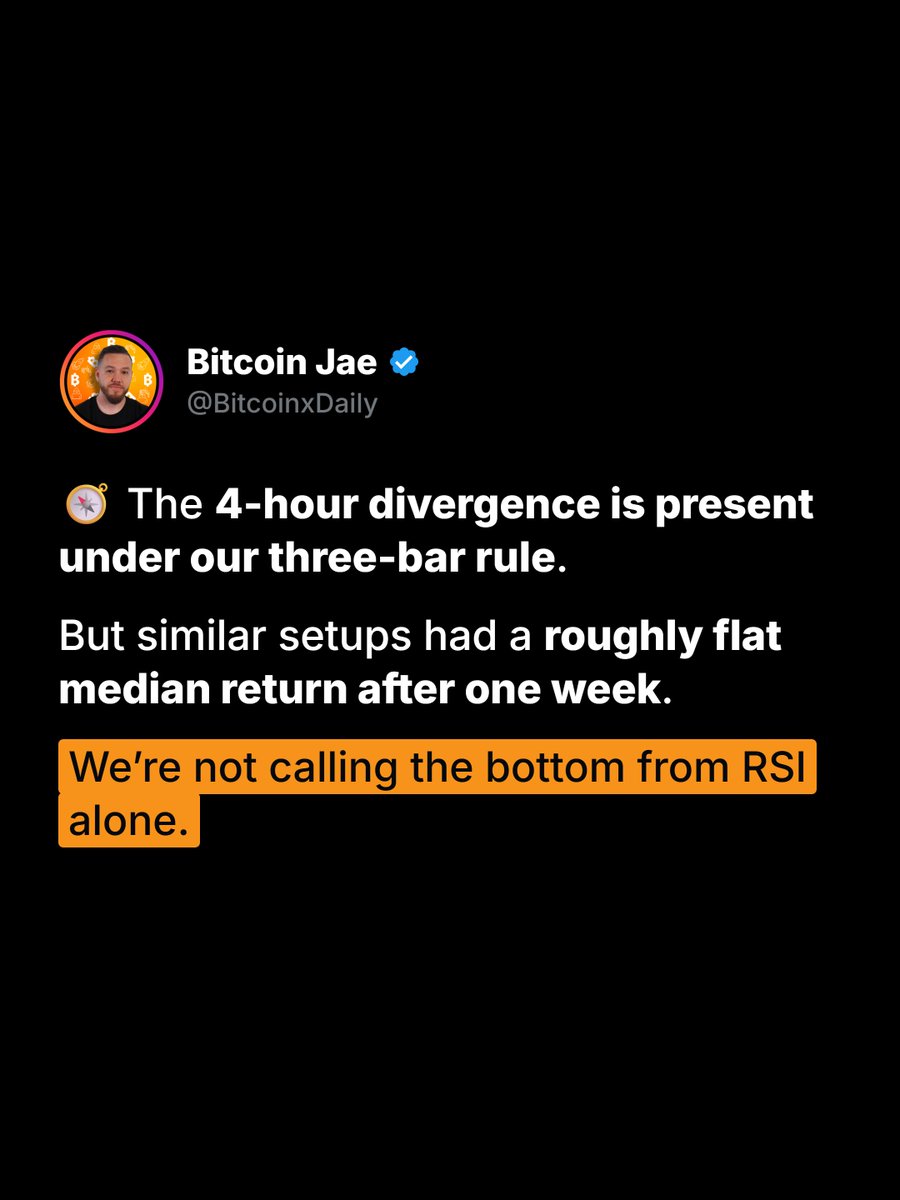
🧭 The 4-hour divergence is present under our three-bar rule.
But similar setups had a roughly flat median return after one week.
We’re not calling the bottom from RSI alone.
$BTC Daily Analysis Report 🧵
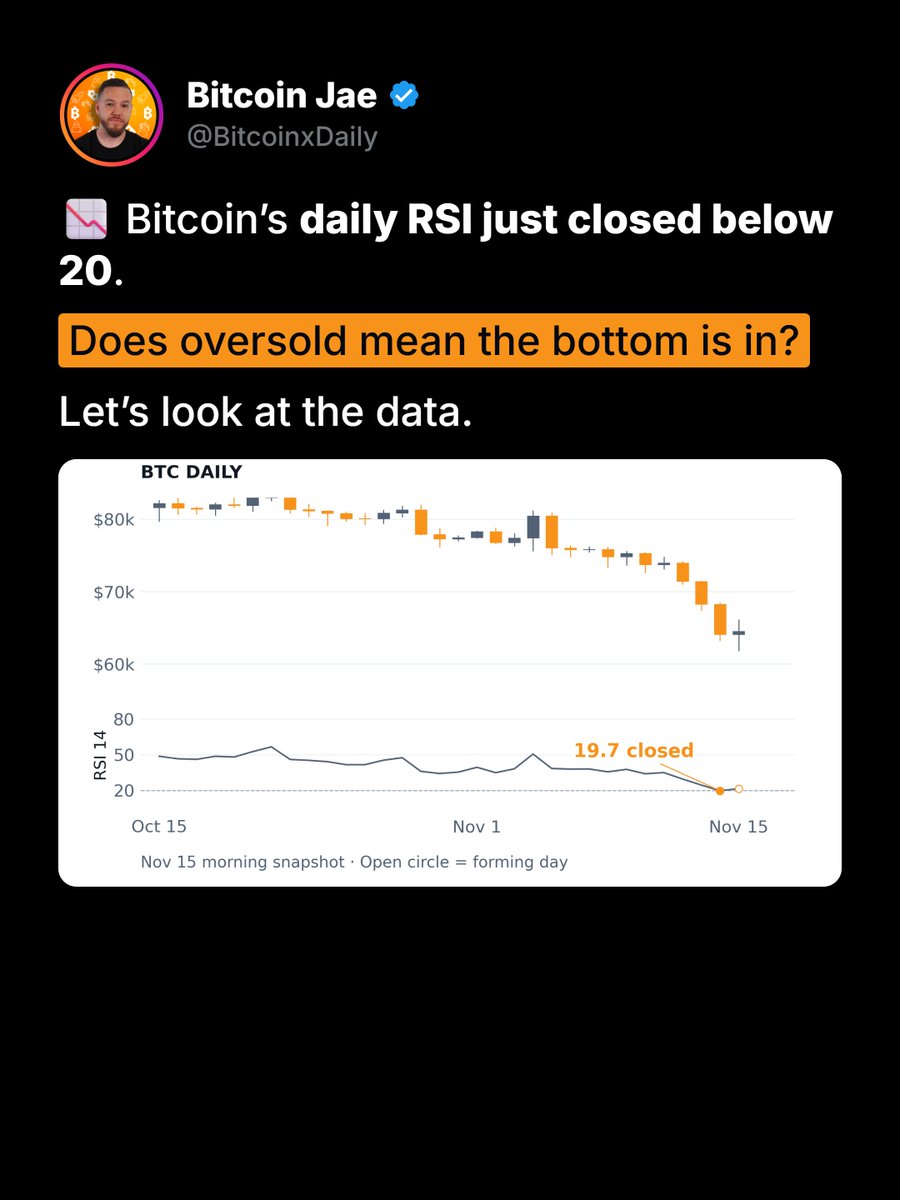
$65,484. Wicked to $61,802 yesterday, lowest since July, as rate hike bets and ~$1.9B of ETF outflows in 7 sessions forced ~$1.5B in liquidations. Bounced $3.7k since. Dead cat or the flush that ends it? 👇
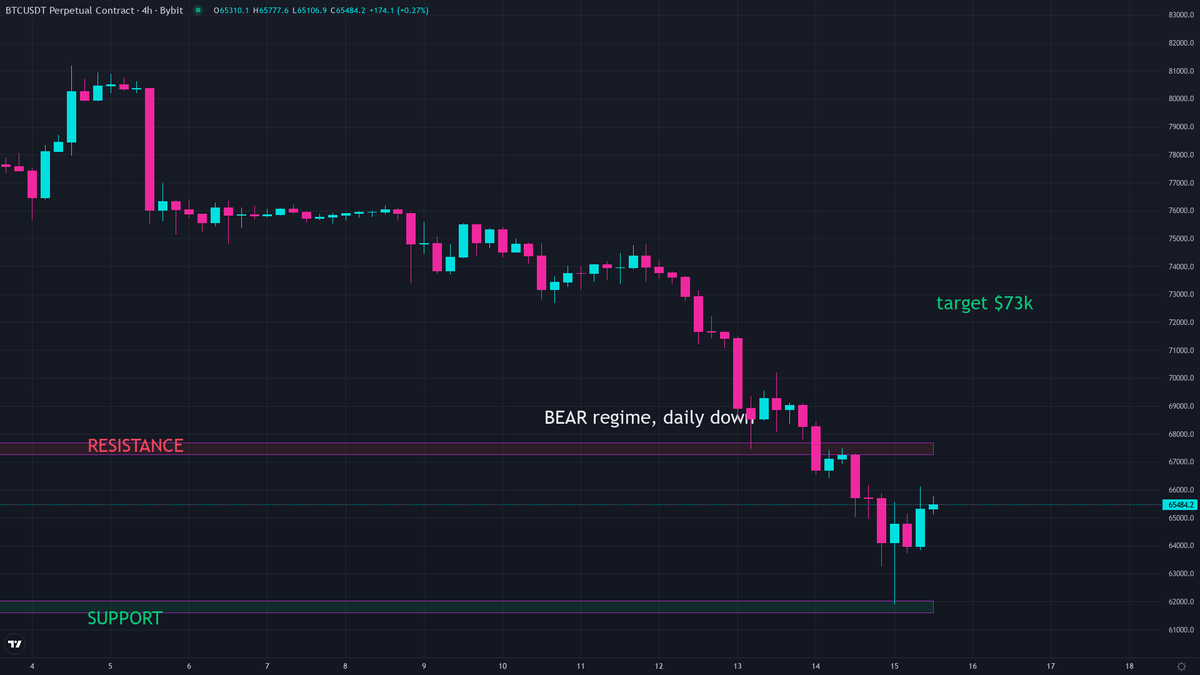
$61,802 is the line. Hold it and the bounce can stretch to $67,469. Lose it and the floor is gone.
I called DOWN yesterday. $BTC obeyed, -2.44%.
Today's call: DOWN. Expected range $63,989-$66,980. I grade it at tomorrow's close. Screenshot it.
Long or short here? 👇
$BTC Daily Analysis Report 🧵
$65,484. Wicked to $61,802 yesterday, lowest since July, as rate hike bets and ~$1.9B of ETF outflows in 7 sessions forced ~$1.5B in liquidations. Bounced $3.7k since. Dead cat or the flush that ends it? 👇
Not calling an exact entry. Here are the levels and the two scenarios:
BULL: reclaim $67,469 (yesterday's high). That opens the run back toward the $73,786 week open.
BEAR: lose $61,802. That's the 5d and 20d low in one print. Nothing on the map under it.