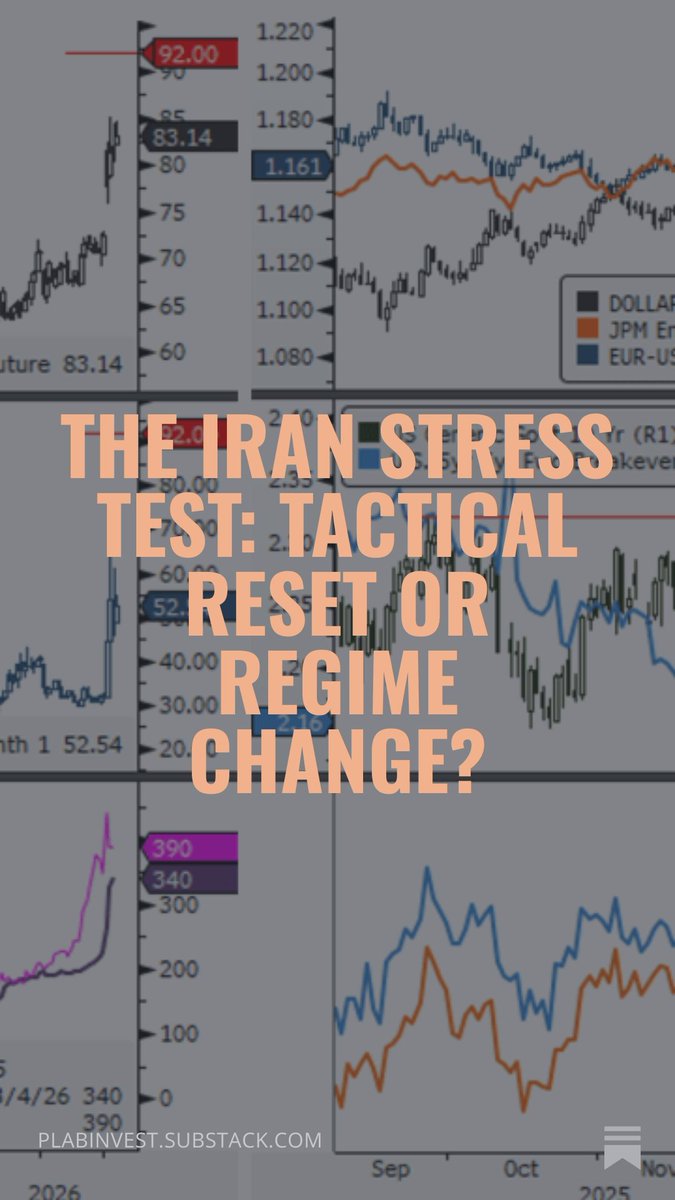
Iran headlines are volatile. We recommend sticking to the facts.
Our Iran Conflict Dashboard tracks the crisis in real time: Missiles, energy flows, and macro spillovers, drawing from BCA’s latest charts and analysis.
(🔗 in replies, updated daily, not paywalled)
O arbitro,
O giocatore.
Tutto qui.
Chi accampa complotti costituzionali inesistenti non può eludere questo semplice ed essenziale principio di democrazia liberale.
Se il giudice non è terzo, il
processo è un’ordalía, l’indipendenza è una finzione, e l’efficienza un miraggio. Auguro a chi sceglie lo status quo di non finire mai vittima dello stesso sistema illiberale che oggi vuole mantenere.
The Iran Stress Test: Tactical Reset or Regime Change? Three pillars of the 2025 rally are cracking. What the bond market, oil, and Bitcoin are telling us now. https://t.co/wTLaIM49ii
This bull market is broadening, fueled by an aggressive rotation out of Technology names.
While we remain constructive on the broader market for 2026, we can’t ignore when the pendulum swings too far in one direction.
(1/4)
The mega-cap trade is unwinding.
Not with a crash — but with a rotation:
→ Equal-weight S&P beating cap-weight
→ Financials & industrials leading
→ AI capex peaking at 4.4% of GDP
A broader, more sustainable bull market is beginning.
https://t.co/FUMsrf8799
Core Thesis: Structural monetary inflation → driven by a debt-refinancing → 65-month liquidity cycle → currently transitioning to turbulence → within a geopolitical shift to a bipolar (US vs. China) monetary system (US stablecoins vs. Chinese gold-backed credibility).
LIVE NOW - The Real Crypto Cycle: What Happens When Global Liquidity Peaks
Global liquidity veteran Michael Howell (@crossbordercap) joins to map out the “master variable” driving asset price:
A 65-month global liquidity and debt refinancing cycle that underpins booms, busts, and the recent “everything bubble.”
He breaks down:
- the coming debt maturity wall,
- rising repo stress,
- the shift from Fed QE to “Treasury QE,”
- and a new capital war between a US dollar stablecoin system and China’s gold-backed strategy.
Plus, what all of this means for our bags and how to position as the current cycle rolls over.
--------------
TIMESTAMPS
0:00 Intro
0:45 Global Liquidity: Theory of Everything?
14:49 Will it Go Up Forever?
24:50 Where Are We in The Cycle?
34:23 Asset Allocation
47:14 Can The Monetary Regime Break?
58:55 China Gold vs US Tech
1:04:29 Crypto & Gold
1:08:03 4-Year Cycles
1:12:40 AI Bubble
1:15:14 Global Liquidity Limitations
1:18:39 Next 3-6 Months
1:20:24 Assets to Hold
1:21:25 Closing & Disclaimers
Wanted to share a few thoughts tonight...
This is from the September 11th MIT publication that dropped on @RealVision:
For starters, unemployment keeps grinding higher, exactly as our lead indicators and GMI/MIT work flagged back in Q1.
That keeps the Fed engaged and is why, as I noted in last week’s video update, the market has started pricing in a higher probability of cuts at the September, October, and December meetings...
US unemployment is now at 4.3%, right on the Fed’s low estimate for 2025 (chart 1).
If it drifts toward 4.5% or 4.6%, as our lead indicators suggest, that’s a green light for more cuts into 2026, even though there are early signs the employment cycle has already turned up. More on that in a moment...
At the same time, unemployment breadth peaked over a year ago and continued to fall in August (chart 2).
Quantitatively, this is a good sign. The index rises into recession, it doesn’t fall…
We peaked last June at 92%, but it has since dropped to 62% of US states reporting a year-on-year rise in unemployment.
Now, take a look at this next chart...
This index tracks weekly overtime hours in the most cyclical parts of the US economy, with data back to the 1950s (chart 3).
Every recession has come when it rolls over toward the -2 standard deviation level, and we are nowhere near that.
Additionally, the August data showed a further pick-up in overtime hours, which, as I have been highlighting in these reports, is much more consistent with an early-cycle economy trying to build momentum than anything else...
This is exactly why S&P earnings revisions keep exploding higher, just as we’ve been expecting (chart 4).
The Fed is cutting rates right as the business cycle is turning up. That’s hugely bullish for risk assets.
These aren’t late-cycle recession cuts. They’re early-cycle insurance cuts... two very different things.
The end of The Waiting Room is near...
It’s been five days since the August jobs report dropped, and I’ve gone through at least 20 takes. The narratives are all over the place, making it hard to separate signal from noise.
Here’s what actually matters:
Unemployment keeps grinding higher, exactly as our lead indicators and GMI/MIT work flagged back in Q1. That keeps the Fed engaged.
At the same time, the earliest signs of a cyclical recovery in employment are already showing up in the data.
Our GMI Early Workforce Activity Index makes that crystal clear (chart 1)…
So on one side, you’ve got the Fed anchored by lagging unemployment data. On the other, the forward-looking data is already turning higher. Classic Business Cycle Dominoes in action (chart 2).
The punchline? Bullish…
The Fed is easing into a cyclical upswing, as shown in our lead indicators (chart 3).
And that’s exactly why S&P 500 earnings revisions are exploding higher (chart 4).
I’ll unpack all of this and more in this week’s MIT report on @RealVision. Drops tomorrow.
This chart comes from the Financial Times article on “the biggest sell-off in the US junk bond market since 2020, signalling growing angst among investors that an economic slowdown will hit corporate America.”
Compared to equities, corporate credit spreads have taken longer to reflect the deteriorating growth outlook. Part of this reflected the confidence investors had in companies' balance sheets and access to new credit, and part was the focus they kept on “all-in yield” providing a sound cushion due to the relatively high “risk-free” element. Now, both are under pressure, particularly for the lower-rated credits in high-yield.
#economy #markets #investing #investors @FT
Liberation day for tariff exposed stocks?
Soon we will be able to observe how much of the negative impact of the measures adopted by all the actors involved is already incorporated in market prices.
https://t.co/7sQUDl9kbd
The fog of (trade) war has slowly wafted over from the beach... Here are my thoughts on both the imminent tariffs and the much scarier ones yet to come. Also, a "zag" to talk about Tobin Tax and why the White House may take it seriously in the future.
From @Gavekal: To borrow a phrase once used about apparently elusive productivity gains, de-dollarization can be seen everywhere except in most datasets; usage of SWIFT global payments system suggests that the move away from Western currencies is largely a DE-EUROIZING effect, with only a small rise in share of renminbi payments; since late-2020, when US$ and Euro each represented about 38% of global payments, US$ has jumped to nearly 50%, with Euro falling to near 20%; RMB up, but to less than 5%