Championship - xP Comparison | #BurnleyFC and Sheff United were statistically the best teams in the league, despite the former being the biggest overpeformer (17.7 points more than expected). #Boro are the strongest of the playoff teams. #twitterclarets#sufc#twitterblades#UTB
@moz__miller Sure. The model simulates each game 10,000 times based off the shots taken to work out the probability of a home win, away win and draw. From that an expected point value can be calculated. The expected points are then summed up from every game to produce a final league table.
L1 - xP Comparison | Ipswich & Sheff Wednesday topped the xP table. Plymouth didn't even made the playoffs in this model - they outperformed their xP by a staggering 33, thanks to scoring 32 more goals than their xG🤯! (1/2) #itfc#swfc#pafc#Argyle#greenarmy
Oxford were the biggest underachievers, earning 27 points fewer than expected. This was mostly down to them conceding 16 goals more than their xGA. Their xP had them finishing in the top 6! The bottom 4 remained the same. (2/2) #oufc#coyy#dcfc#bwfc#pufc#Pompey#cafc#MKDons
📊 BIG THREAD OF EFL LEAGUE ONE DATA & VISUALS
What a conclusion to League 1 this weekend! See below an extensive collection of data visuals covering the entire season, highlighting effective teams and players by a variety of metrics.
Championship to come next week! (1/14)
🚨 League One - Run In 🚨
Good fixtures on paper for Wycombe & Bolton in their play-off push 👀
Ipswich with the toughest out of the top 3...
📸 @BtoBAnalytics
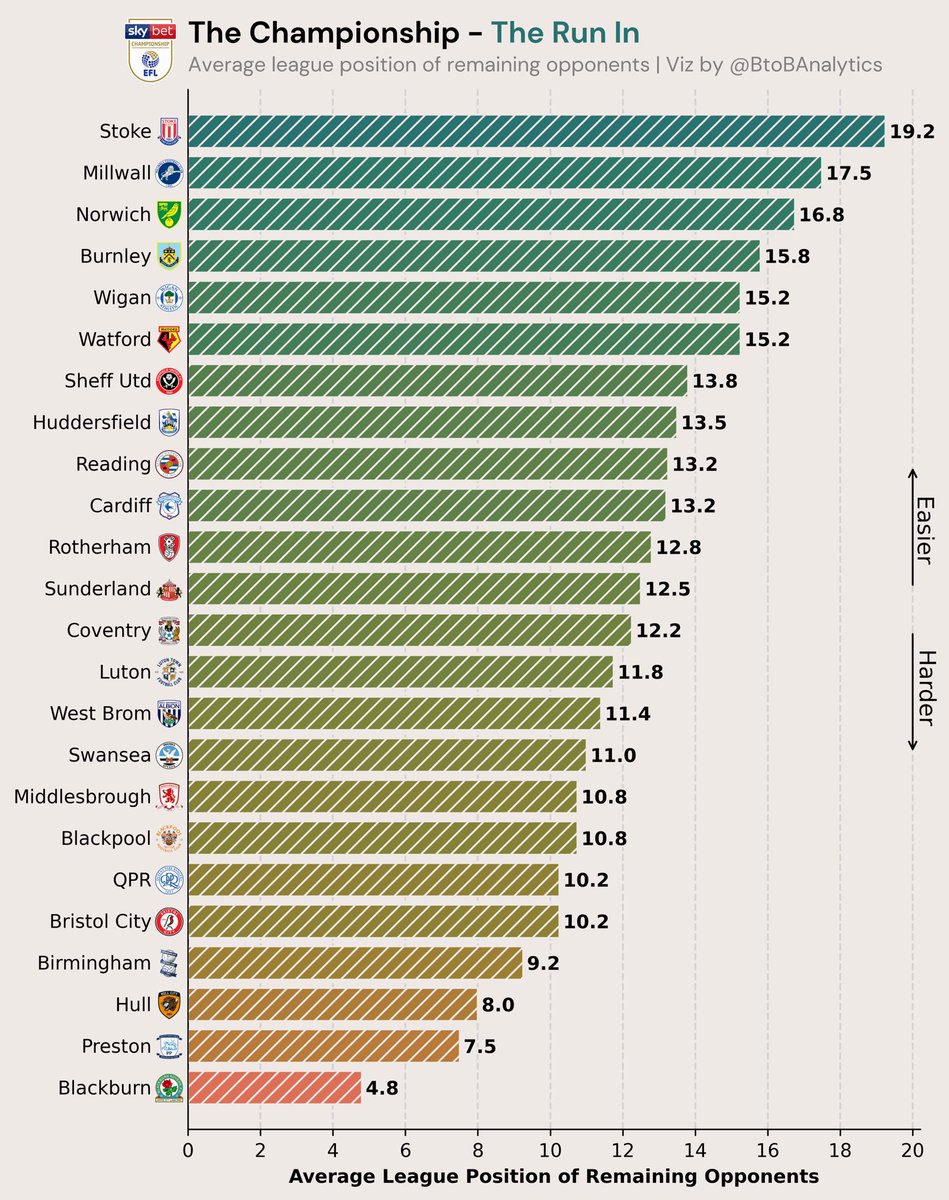
The Championship - Run In
Preston & Blackburn will have to pick up the necessary points from the toughest fixtures to get into the play offs 😳
📸 @BtoBAnalytics