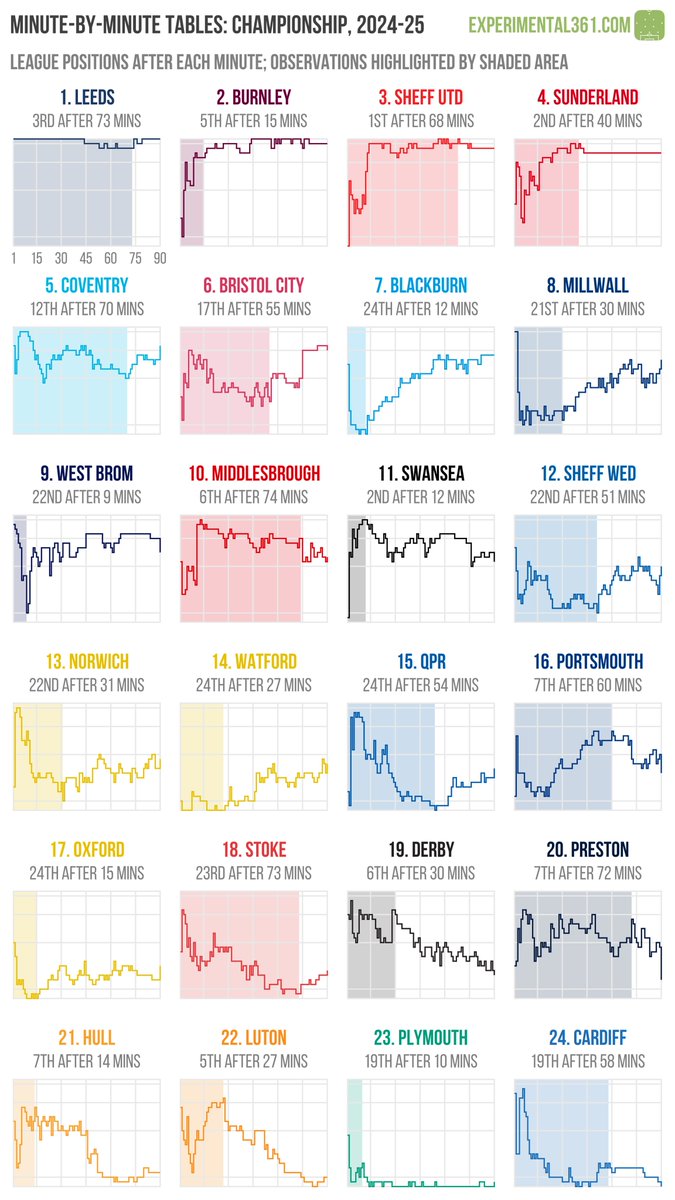
Trying out another new template: recalculating the league table after each minute of play to show when teams performed relatively well (and not so well).
Each mini-chart highlights an interesting cut-off for a team.
Full explanation via the link: https://t.co/K0cwWFEAz1
Stoke weren't able to end their wait, although they'll get another chance if their game with Sheff Wed goes ahead.
I've written something on the longest waits for a team to sit top and bottom of a table here, and the latter is even more interesting: https://t.co/XTgUjY7aNb
By my reckoning if @stokecity are still top of the @SkyBetChamp at the end of today, it'll be the first time since 27 April 2008 that they've ended a day top of a league table. At 17 years 3 months 12 days it's the longest such drought among any of the current PL and EFL teams.
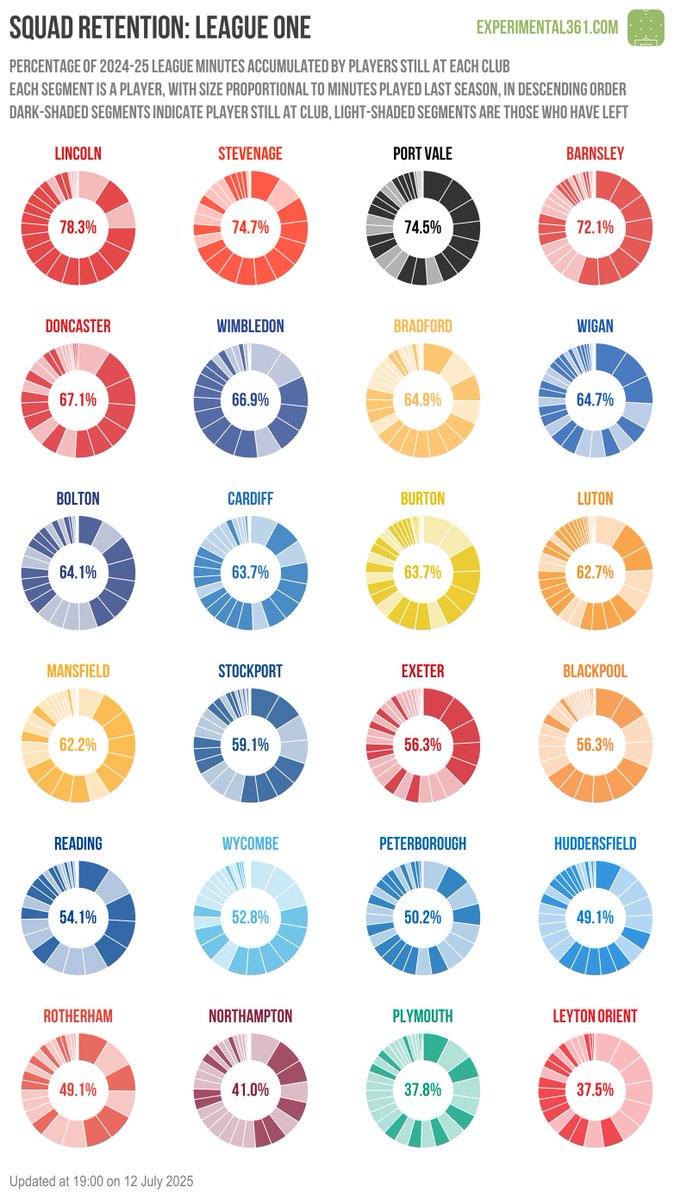
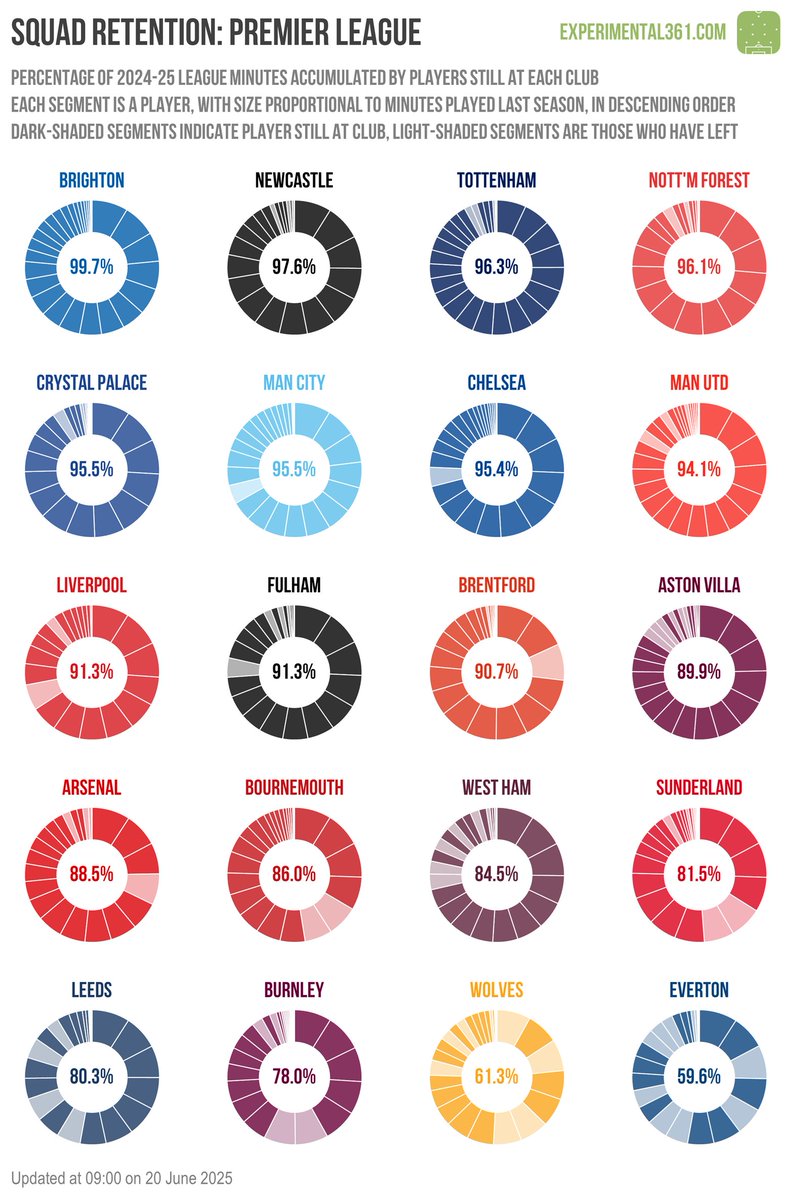
I've created squad retention charts at the top European leagues (Italy, Spain, Germany, France, Netherlands & Portugal): https://t.co/StrXIsVdG9
I thought there was a bug when I saw Alverca's profile, but it turns out they have only one player left from last season.
@JheriMr Not just off these numbers, no. I guess the quality of recruitment (and perhaps how early you get it done) is a bigger factor. I have a deeper dive into this data on my "to do" list to see if there's anything interesting in subsets of it.
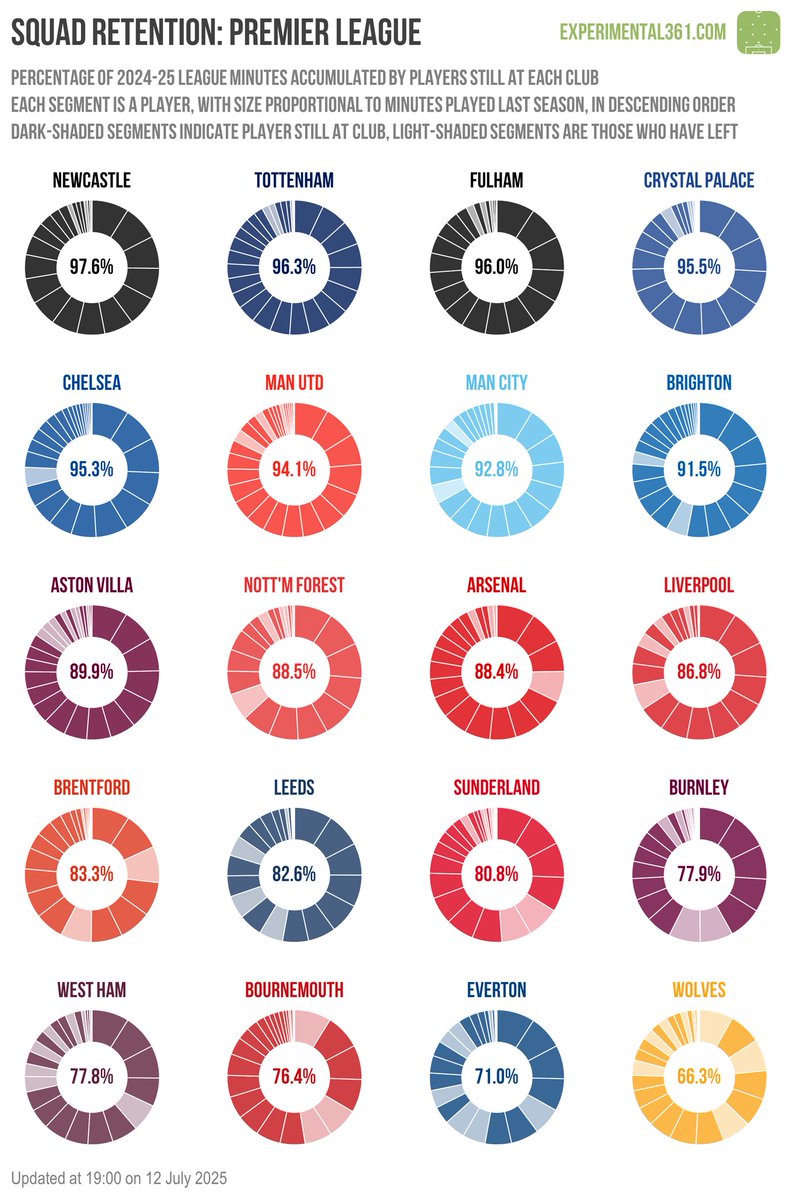
I am continuing to refresh the squad retention graphics on a weekly-ish basis: https://t.co/YgIWb2JLRC
Leyton Orient now without 7 of their 8 most-used players from last season.
@OdelBet Yes I'll add it as a link to the post. I didn't include it initially as I wanted to get some early season lineup data to help me catch anyone that I missed.
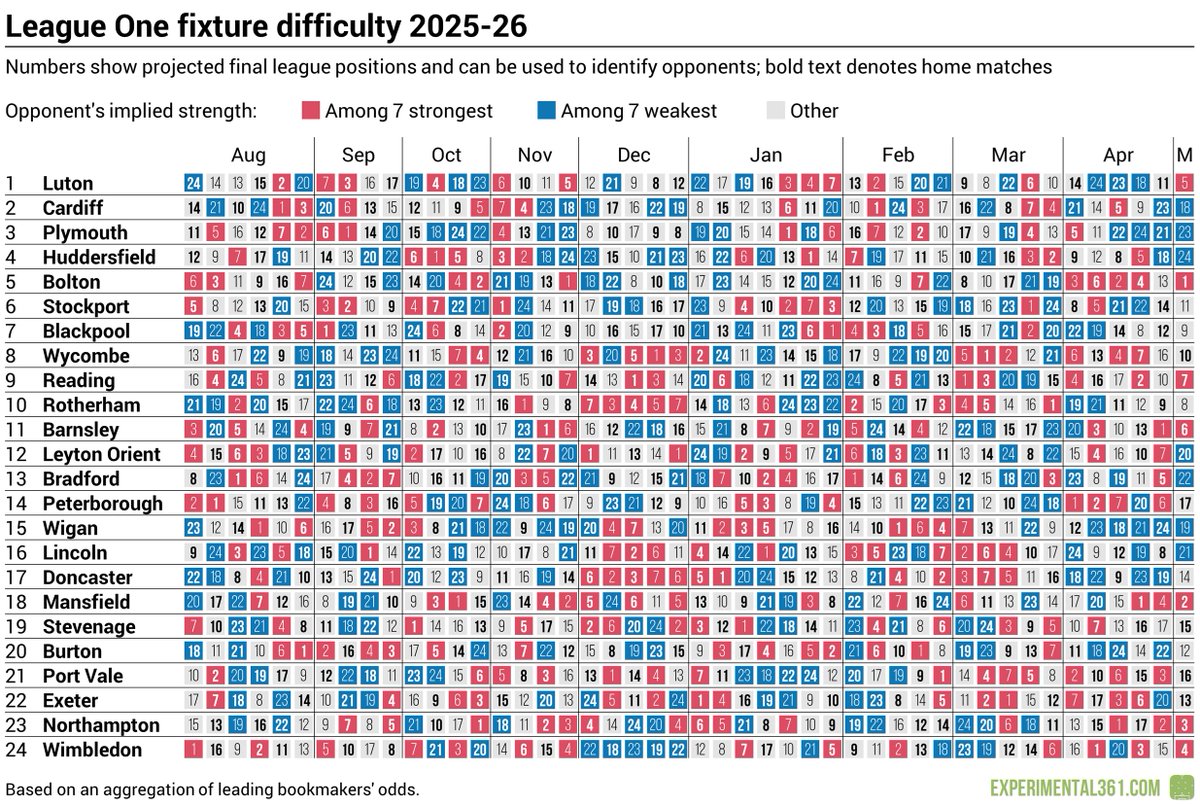
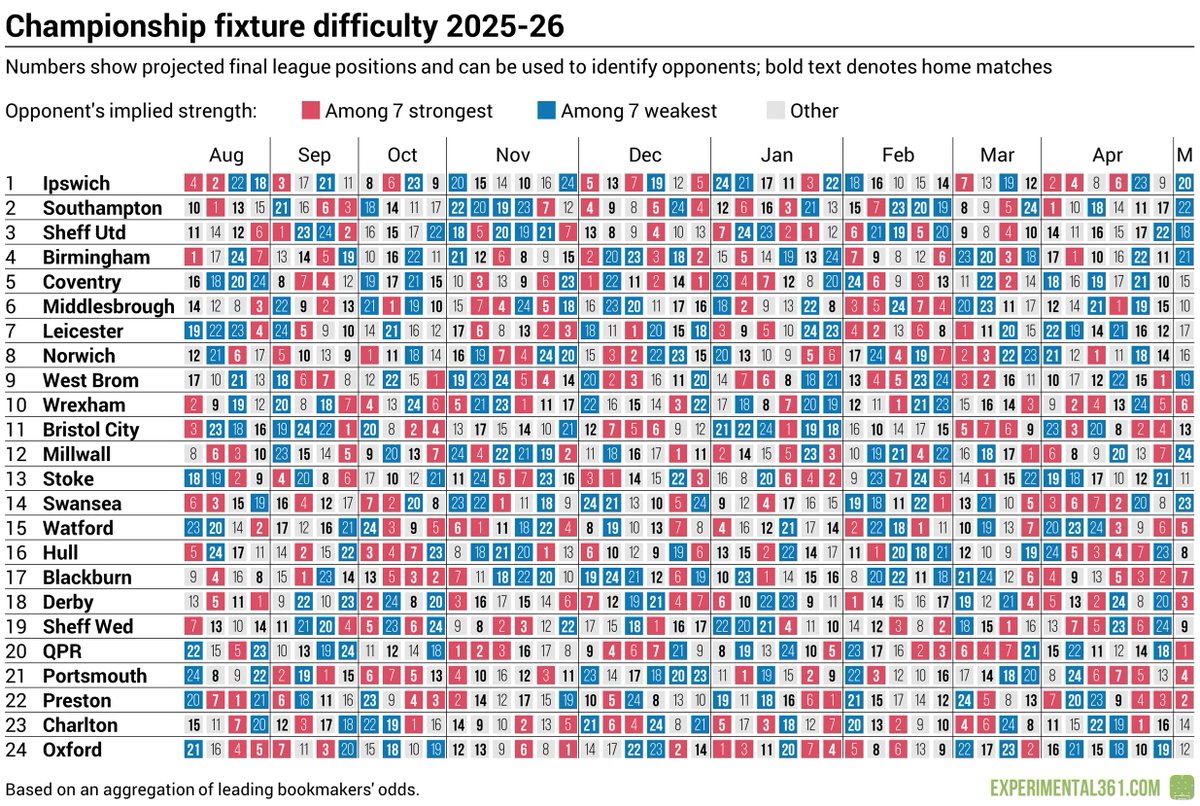
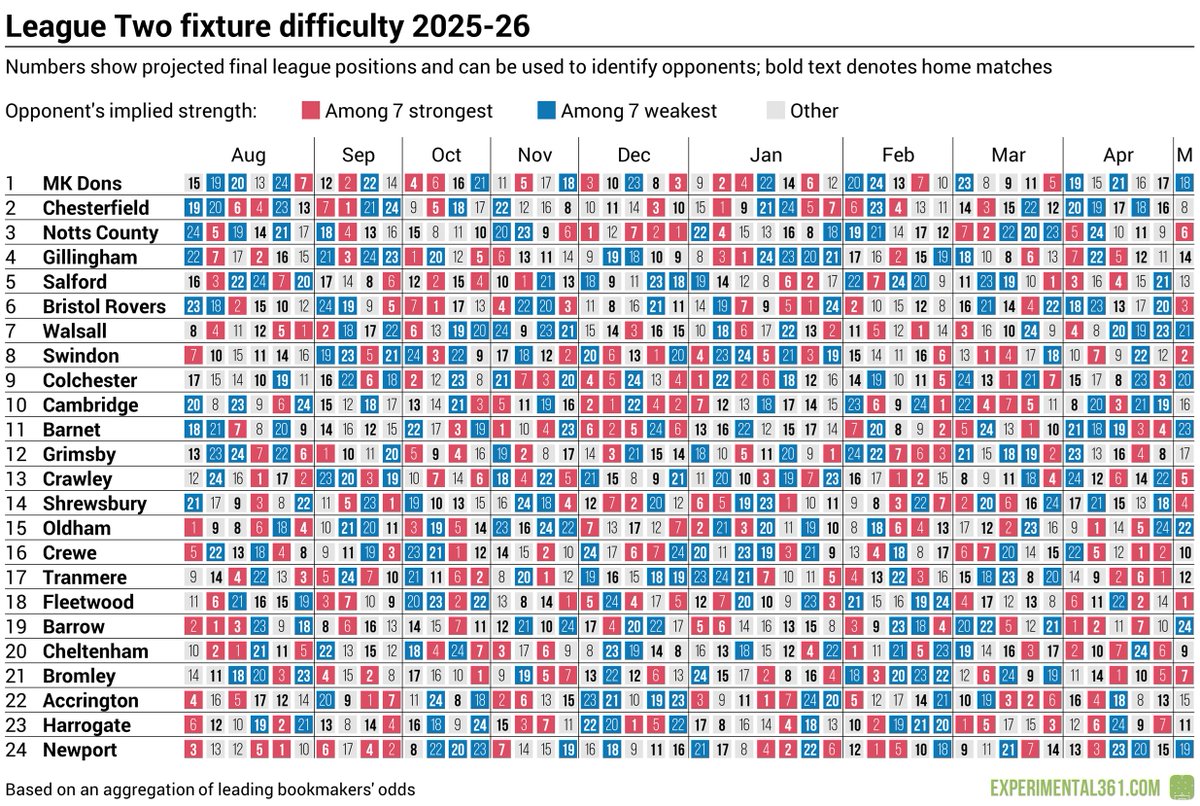
As the new EFL season is almost here, I've updated the fixture difficulty grids as promised: https://t.co/QNwtBZVLnZ
The PL version will also get a refresh in early August.
@Marco4J Yes it feels like some combination of squad depth, fitness and game management would explain a lot of these.
By the time I use these again next season I'll hopefully have enough reports running to pinpoint exactly what's up with each team (e.g. sub usage).
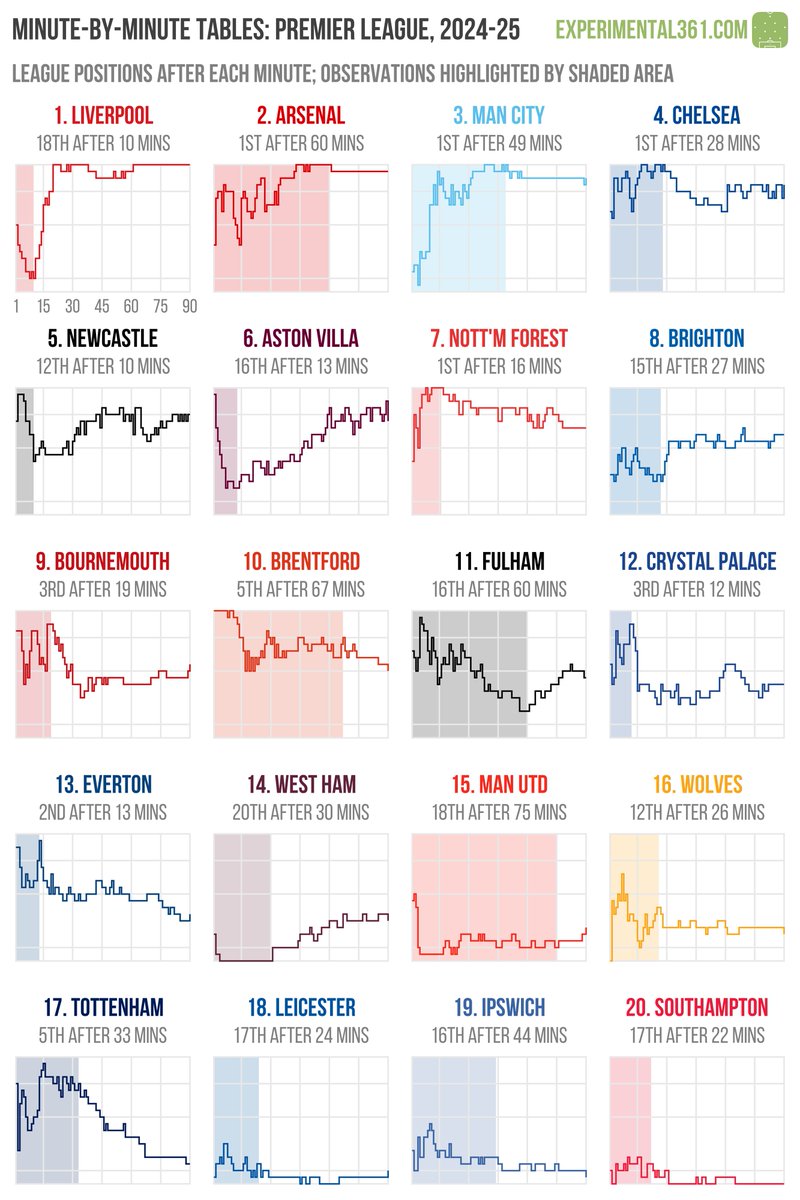
Trying out another new template: recalculating the league table after each minute of play to show when teams performed relatively well (and not so well).
Each mini-chart highlights an interesting cut-off for a team.
Full explanation via the link: https://t.co/K0cwWFEAz1
I've started tracking squad retention for every Premier League and EFL club - this page will be refreshed regularly during the transfer window: https://t.co/krSvWDzaKY
@AshleySLawrence I figured out what happened - some of Man City's odds are skewed by the potential FFP punishment e.g. their relegation odds are around 20/1 (compared to 300/1 for Newcastle). Annoyed at myself as I caught this last season!
As is traditional, here's a Premier League difficulty grid, smashing together the newly-released fixtures with the latest betting odds: https://t.co/Um2UkzMPuS
@AshleySLawrence Thanks for spotting that - not sure how it happened! Some quirk in how my code aggregated the various outright markets I think. Fixed in the post now.
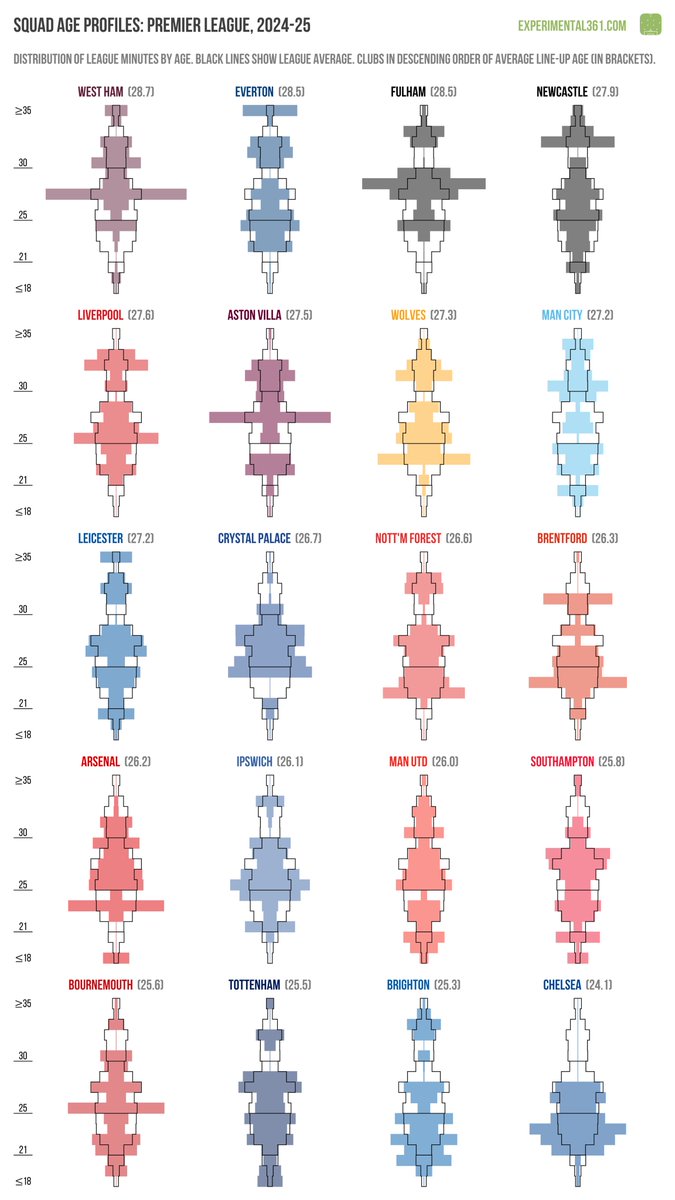
Added a batch of post-season visuals to the site today, including scatter graphics, game states, league table footprints and a reworked set of squad age profiles (all available via this link): https://t.co/S1QLnaEJNI
More to follow over the coming weeks.
@Sam29403527@secondtierpod I just had a look at Southampton and I think the difference is that I've not included play-off games (2 wins and a draw in their case).
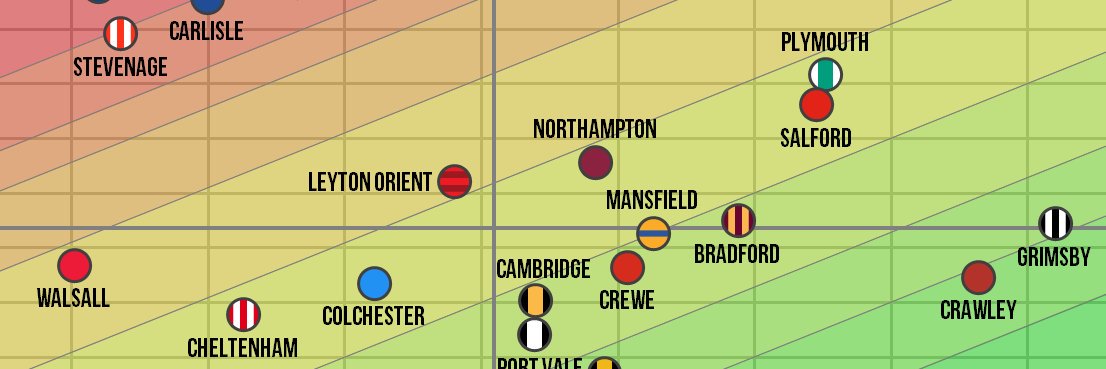
I've fired up the scatter graphics for the Premier League and EFL - there are links in this post to the complete set for each division: https://t.co/o31ZbJ1BfZ
@PhilLUFC@thehuwdavies@NTT20Pod I've "unravelled" them into straight lines before, so like what you've shown but with the slices still in the same order from 0-100.
I guess there's always a trade-off with these choices e.g. your version brings out the percentages more and is easier to re-size / scale.