We have a new blog post: Representing Compound Events on Cal-Adapt that explores some of the new climate indicators on https://t.co/P2HXZ3GbWD
https://t.co/ZekYNpBHjC
@marymacherie93 @chrislhenrick Hi Maryanne, sorry to hear you are having trouble with the website! Please email [email protected] describing what you are seeing in your browser so we can troubleshoot it for you. If you could include your browser details using https://t.co/c0PX604IhD that would help.
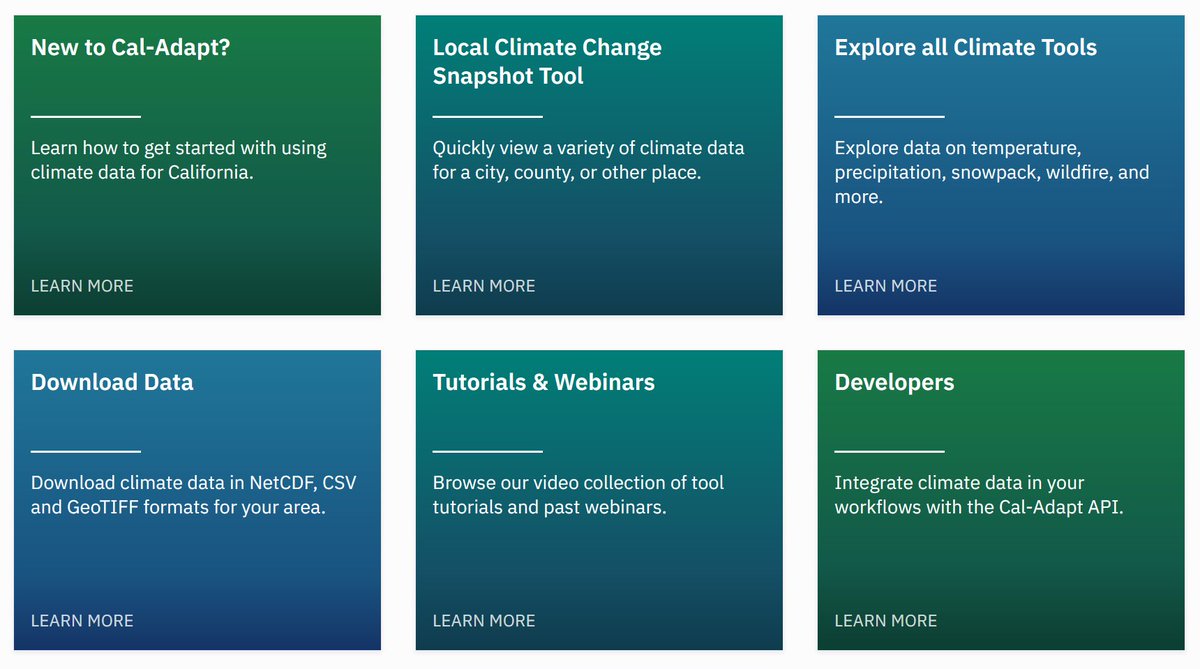
After months of hard work, we are happy to announce launch of our updated website! https://t.co/gGVyEaxztf
Whats new? updated Help, new Get Started section for working with climate data, better tools ux & links to other state climate resources
Learn more https://t.co/tzLBgSRHK4
Big update this weekend to caladaptR, the R package for importing and manipulating climate data from @Cal_Adapt. New functions for managing rasters, large queries, plus *5* new vignettes. Stay tuned for a workshop announcement. https://t.co/WzH5z2I5au
We are hiring! Eagle Rock Analytics has three positions open to develop a #climate data analytics engine and platform funded by @CalEnergy to drive data smart climate resilient investment in the #energy sector. https://t.co/Tm7uiCX5hE
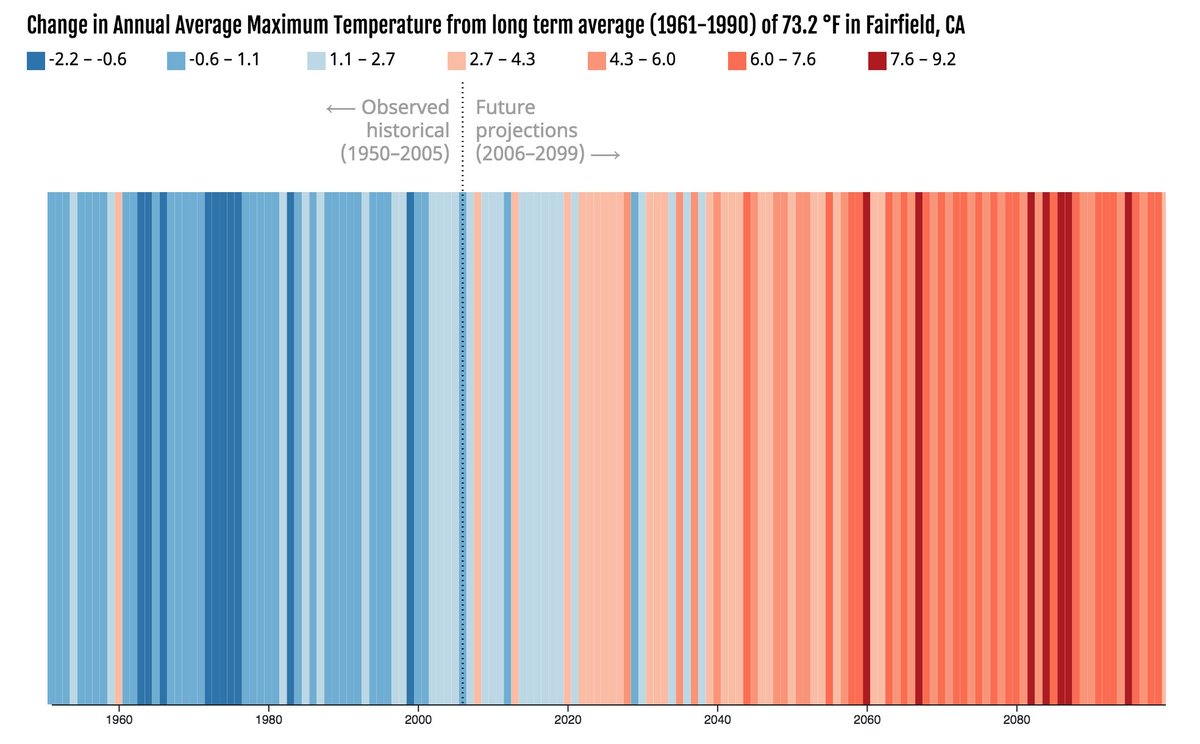
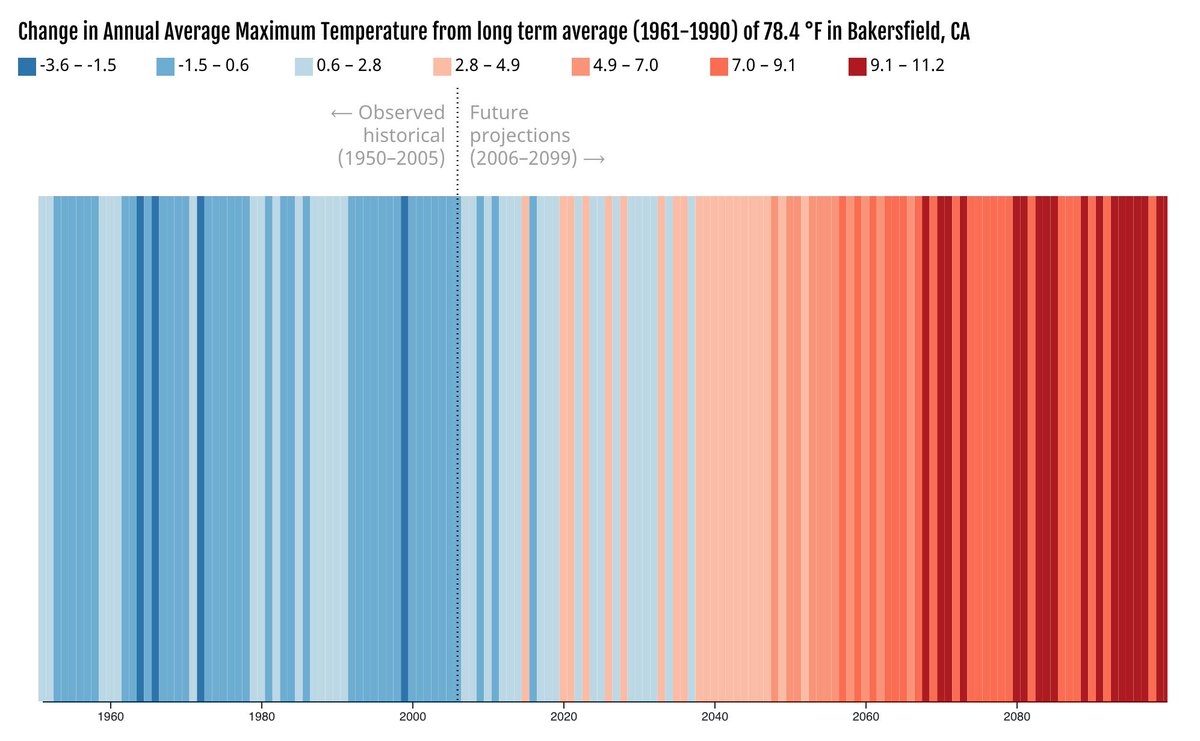
Projections of future warming for California cities using climate data downscaled for California #ShowYourStripes
Inspired by @ed_hawkins Built with @observablehq
https://t.co/BpqnxIU2Vh
.@Cal_Adapt 's Local Climate Change Snapshot Tool is live! Developed w/ grant funding from SGC's Climate Change Research program, the tool provides climate change variables for a location of interest in a single interface. @CAClimateInvest
View the tool: https://t.co/lQ7UhcPQ28
Great day for California's climate resilience efforts -- nice that the critical role that @Cal_Adapt plays in visualizing climate impacts to the energy sector is been noticed!
Confused about climate data? Join us on Thurs Jan. 23, 2020 @12:30pm PST for a webinar on an "Introduction to Climate Data" with our colleagues from @Cal_Adapt https://t.co/FB9EmQ8sNu
Warming stripes for select California cities (1950-2099) under a worst case climate scenario. #ClimateStrike
Inspired by @ed_hawkins. Built with @Cal_Adapt@observablehq
https://t.co/abioagkCCf
Animated diagram of the Earth's Carbon Cycle and how it has changed over time.
Carbon, in various forms including CO2 and organic materials, is continually exchanged between the atmosphere, oceans, and biosphere.
However, human activities have perturbed the carbon cycle.
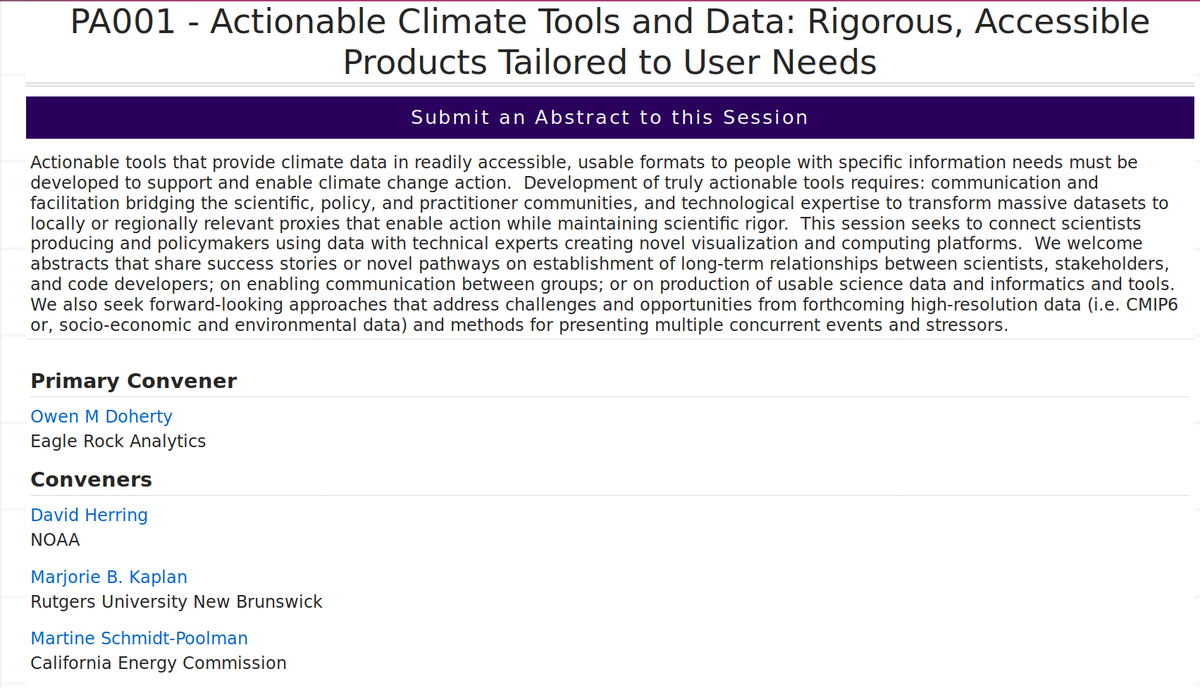
Use climate data? Make climate data? Want to make it better? Submit an abstracts to our session for #agu19. Search "Actionable" or 83436. #climate#policy#Data