$MU $LRCX $STX
Good time to take on some risk in the leaders of the tech cycle.
Price has stabilized off the thematic-wide sell-off, and weakness in the $SOXX this week has given an opportunity for entries at the lower end of what seems to be a basing/reversal area, setting up a potential rally back to ATHs.
All share similar price action, with higher highs and cupping bases around key 6 month support levels.
Structure remains intact until proven otherwise, and with a clear visual of the setup, RR is attractive with clean stops in the case of a failed reversal.
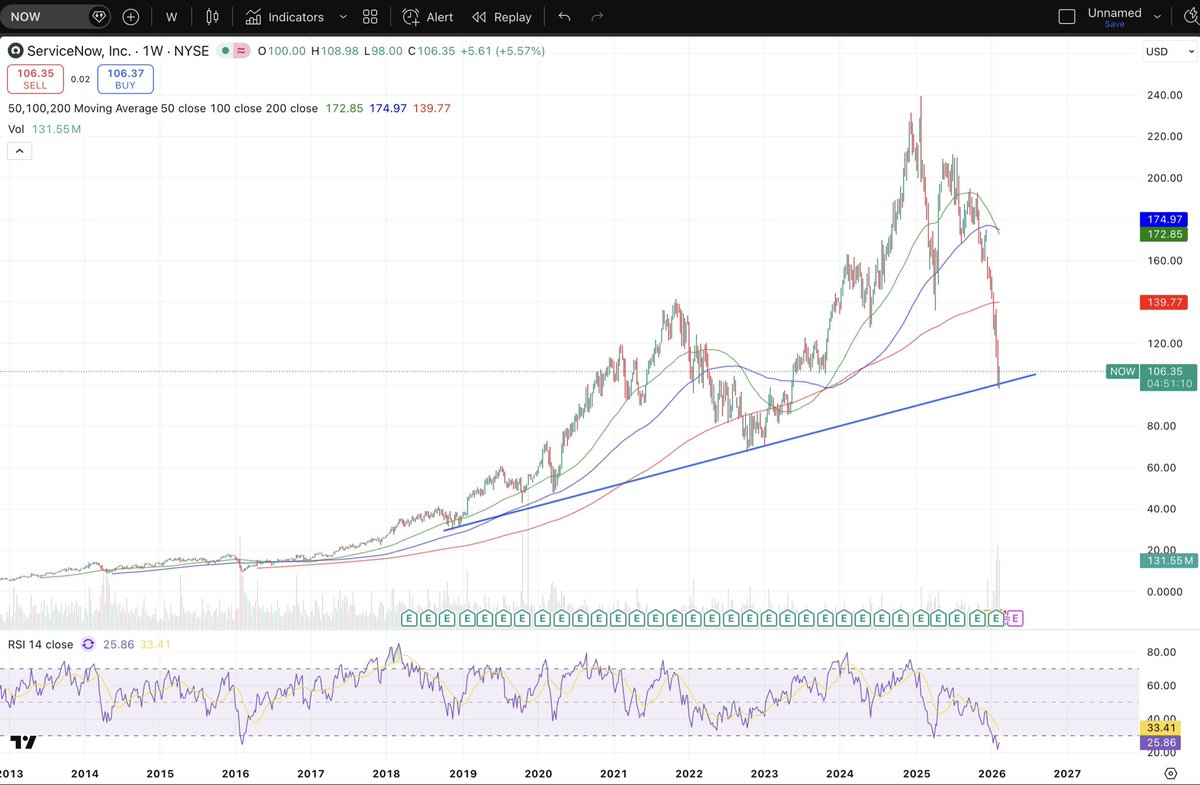
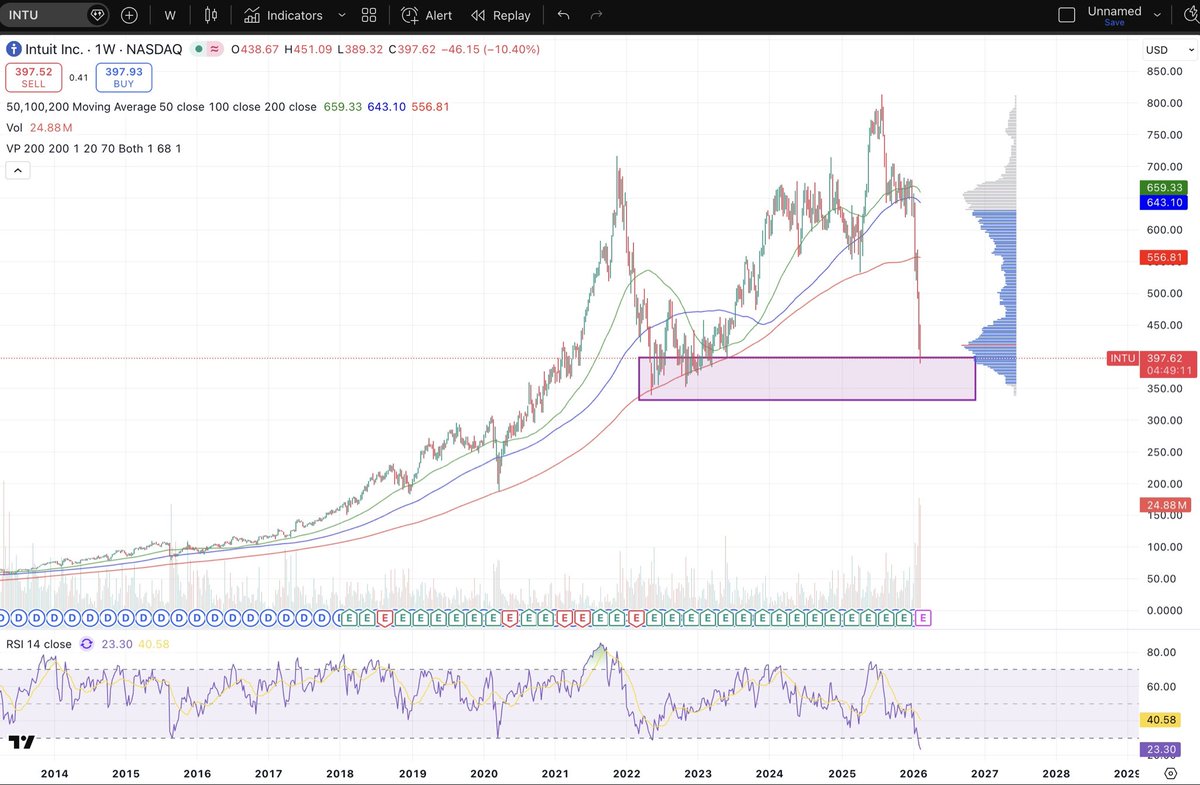
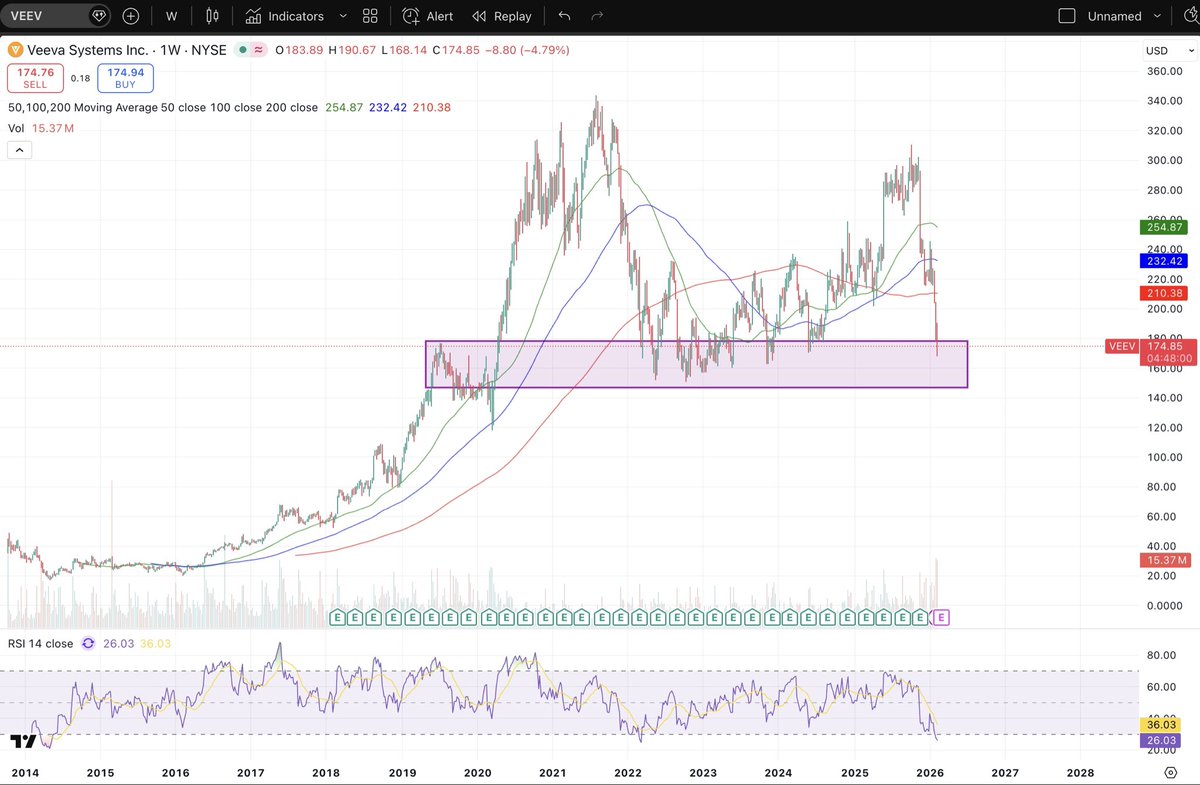
$NOW $INTU $VEEV $CRM
There are some basic truths about markets that can be used to profit when applied selectively. Being greedy when others are fearful is one of them.
AI will inevitably put pressure on margins, software enterprises will fail, but high-quality names with real FCF and pricing power will persist.
The current SaaS meltdown is reminiscent of the 2025 broad market tariff sell-off. A headline event which brought down practically every name, only to become one of the best buying opportunities of the last century.
History shows that the best returns are often captured in periods of sector-wide pessimism, when quality businesses become marked down along the structurally weaker names. Stepping away from the headlines and analyzing businesses is how mass sell-offs turn into opportunity.
Fundamentally, these firms are trading at their lowest valuation of the past decade while maintaining strong YoY revenue and FCF growth.
Technically, RSI shows these firms to be extremely oversold, with a few printing their lowest RSI readings on record (weekly). Prices are also approaching major trendlines and key areas of support formed years ago.
Successful investing often means owning assets nobody wants and selling them once everyone does.
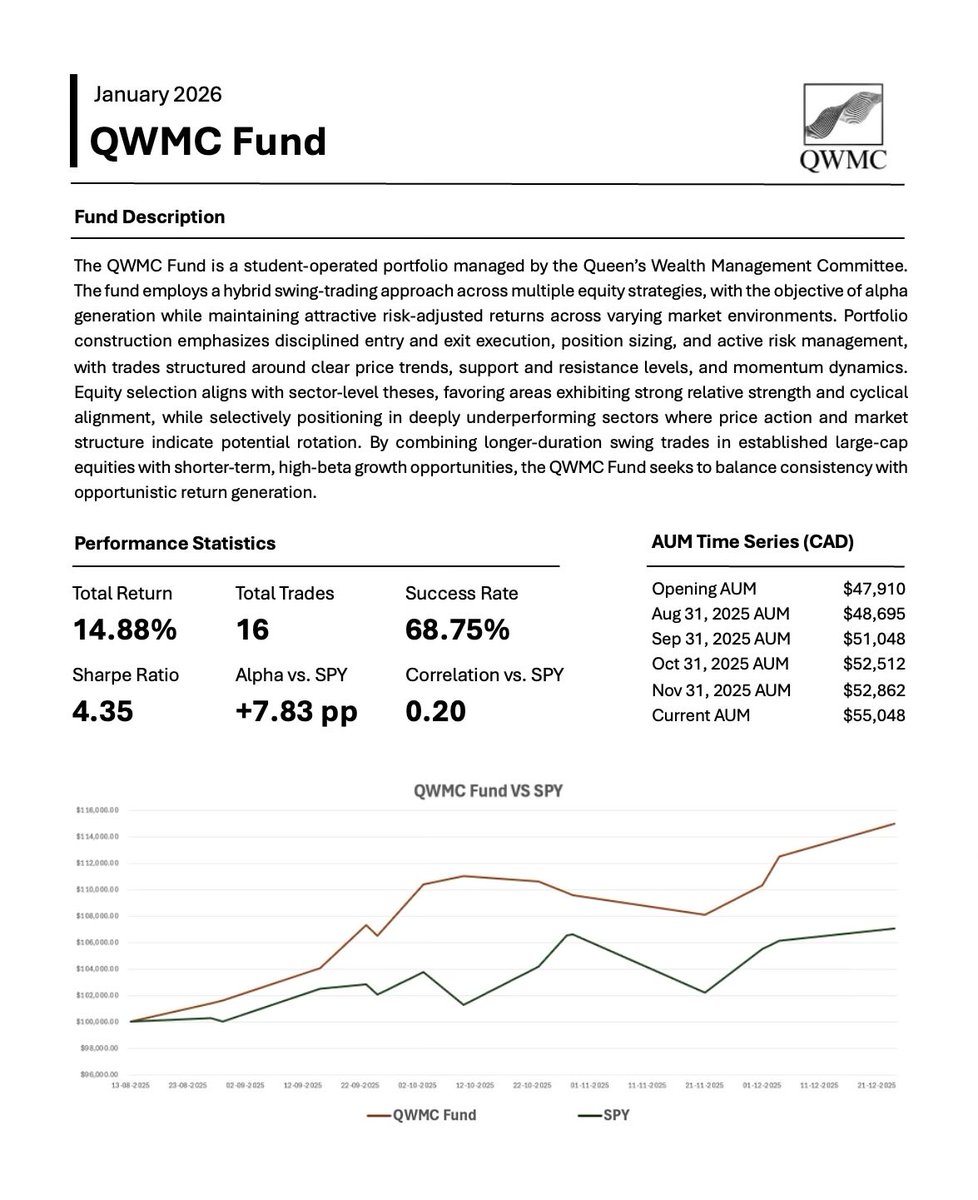
Over the past five months, I acted as Fund Manager for the Queen’s Wealth Management Committee, a student-managed investment fund at Queen’s University.
The fund was managed following a growth and outperformance objective, implemented through a swing-trade framework across multiple long/short equity strategies. Primarily 5–8 week positions in established large-cap equities coming into key support/resistance levels, structural reversal setups, or exhibiting strong relative strength and momentum. This was complemented by shorter-duration, 2–8 day trades in high-beta, growth, and speculative opportunities, selectively taking advantage of the thematic landscape in 2025.
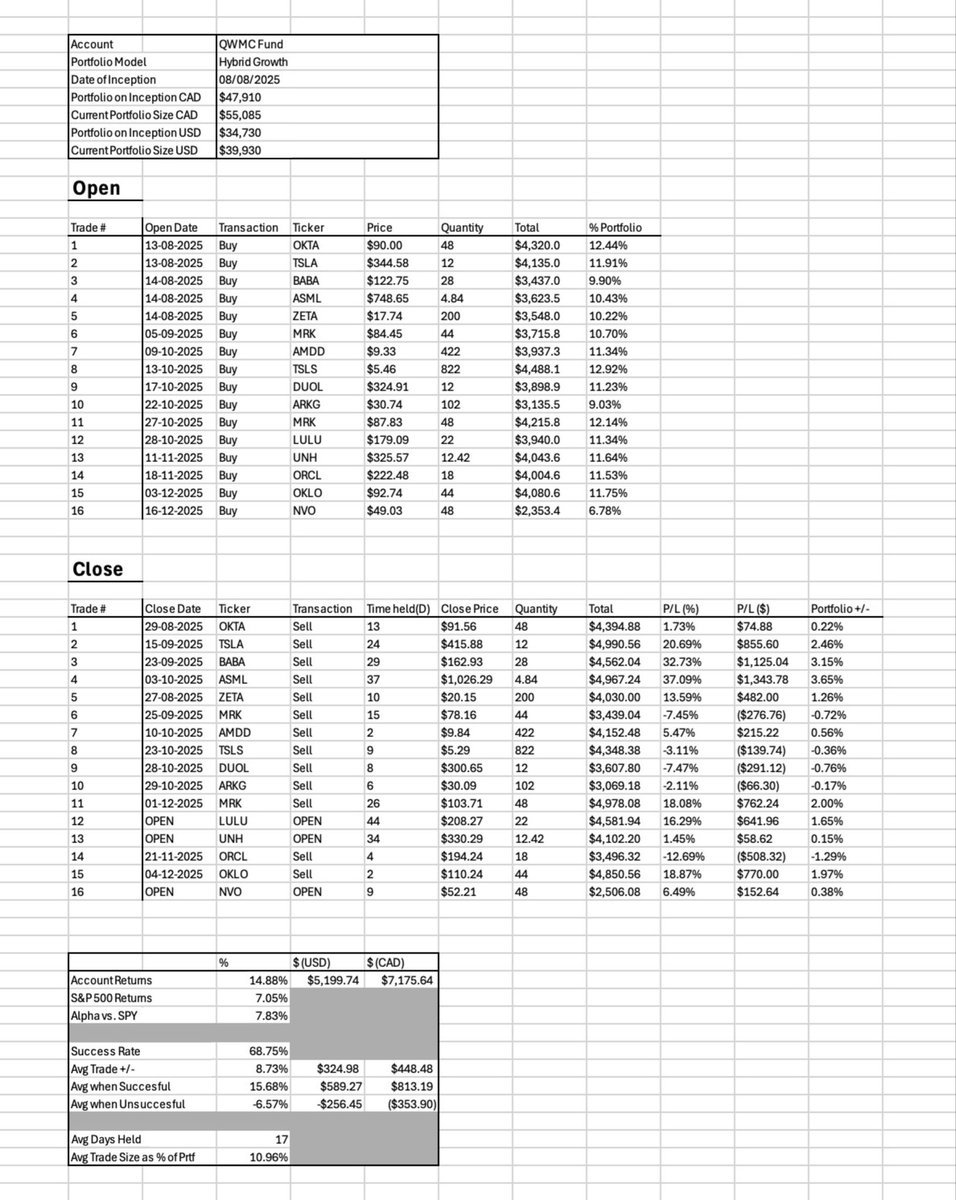
The strategy achieved its stated objectives. Notable portfolio metrics include:
-Total Return: 14.88%
-Total Trades: 16
-Win Rate: 68.75%
-Avg (+/-): 8.73%
-Avg Trade Size as % of Portfolio: 10.96%
-Sharpe Ratio: 4.35
-Max Drawdown: -2.97%
-SPY Return: 7.05%
-Alpha vs. SPY: +7.83 pp
-Correlation vs. SPY: 0.20
-Beta vs. SPY: 0.16
A complete trade log since inception is included in the second image.
Pattern recognition is the ultimate $ maker.
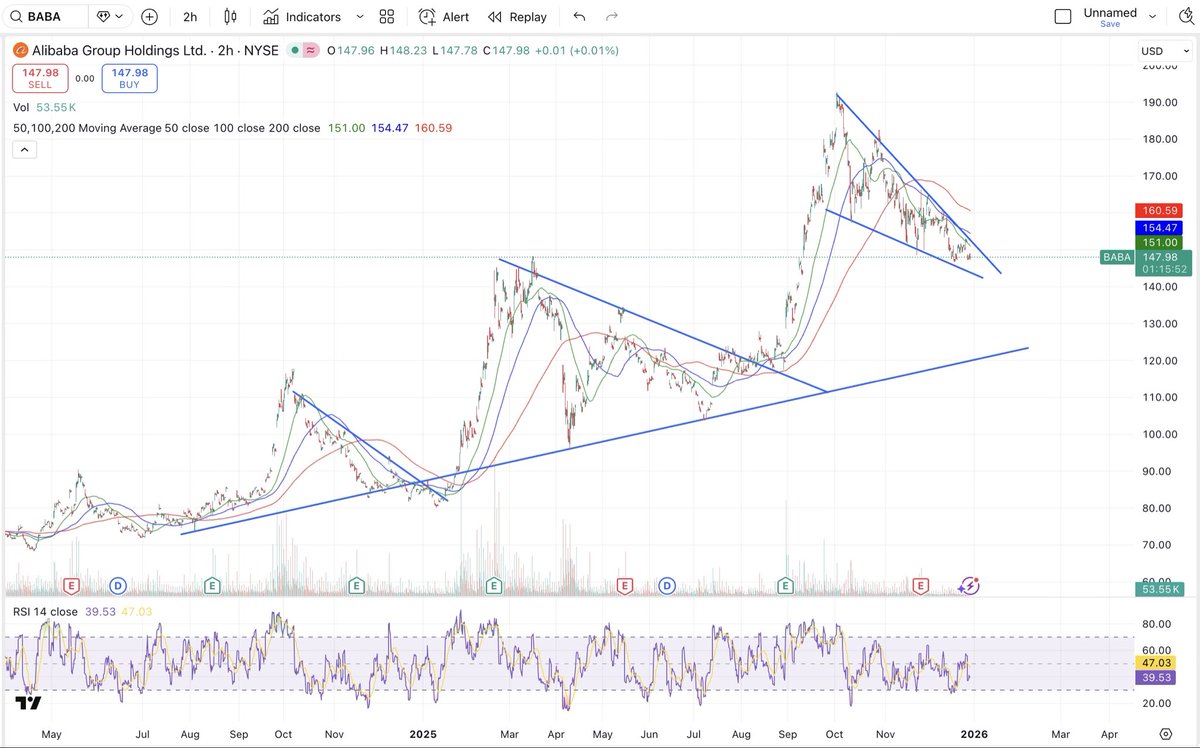
$BABA structured break out following 2+ years of basing.
Looking for either:
-Break above the triangle, retrace and bounce
-Break below triangle to trend line below as support
Moving average crossover for confirmation.
Break above to 52-week high is ~40% upside.
Chinese equities tend to exhibit recurring price action patterns, and in waves. Companies/sectors like this are best to trade, and create strong alpha opportunities over buy and hold.
If Charlie Kirk can get shot for speaking his mind, then Elon Musk could be shot at too. Tesla should also dedicate serious resources for his safety. For now, I hope he avoids public appearances. The U.S. MUST protect @elonmusk at all cost!
$IBM
Circled areas = Daily RSI < 30
Pivot/short-term low on every occurrence since 2020.
Price was higher 5 weeks later 9/9 times, averaging ~15% once bottoming.
Current RSI is at its lowest level since 2018.
However, have not entered yet and only looking for entry as a swing trade, medium/long-term drawdown potential still seems high and break of 200 DMA is not a great sign.
More support near the 100 week. Current price action is very reminiscent of 99’. Sharp retrace back to major support by the 100 week after a strong, several year rally (Refer to last image).
Money does not leave the market, rather, it rotates into other assets/securities.
Who would of thought, the sector which is arguably the most oversold relative to the S&P500, the worst performing sector YTD both absolute and relative to the S&P500, trading at the cheapest forward valuations relative to other sectors in the S&P500, is now at it’s lowest weighting of the S&P500 in 20+ years, and is now at it’s lowest price relative to the S&P500 in 20+years(XLV/SPY), is benefiting from rotational activity within the markets.
As the #mag7 became increasingly deviated from the 200 DMA, probabilities of a pullback became increasingly elevated.
Coming with no surprise, selling action within the mag7 picked up over the past few days, and guess where that capital has been going; Defensives, Healthcare specifically.
This goes to prove the importance of timely contrarian and rotational positioning within the portfolio as an essential hedge against an extremely tech-concentrated market.
$XLV $UNH $LLY $NVO $MRK $SPY
$ASML golden cross opportunity.
3 occurrences on the daily TF since 2019, and have all been great buying opportunities.
If price can get above most recent pivot high, upside potential appears +30% at the minimum.
At this point, I believe downside potential is mitigated, and risk/reward is in the buyers favor.
If you didn’t know, ASML is a vital component to the semiconductor industry, the only company in the world capable of producing EUV lithography machines, a necessity in the manufacturing of advanced chips.
To complement the MOAT, fundamentals are also strong. EPS 19% CAGR, ~30% Net-Profit Margin, ~30% FCF margin.
They also buy back stock at one of the fastest rates in the industry on a percentage basis.
After a period of 65+ days trading above the 20-DMA, and 25 days in a row without a close +/- 1%, seasonality did not wait to kick in, and both were put to an end on Friday.
As for what’s next, markets have plenty of support between the 50 and 100-DMA. Previous ATH support, significant volume profile, 200-DMA, .286 & .382 Fibonacci levels, 13 & 34 week SMA, all in the same range.
Post-breakout chop within this channel would align with the very similar 2020 v-shape recovery.
The bottom of this range would be a 7-8% correction from ATH on S&P 500 index, and would be healthy considering the historic performance since April.
$QQQ $SPY $VIX
For the bulls.
If the market reaches ‘Rest Of Year’ average, S&P 500 will close 2025 up ~14% YTD.
That would be a cumulative 61% increase over the past 3 years.
$SPY $QQQ
With July coming to an end, we are entering the most seasonally strong period for the VIX, and the two of the weaker performing months of the year in August and September.
VIX’s Bollinger Bands are compressed at a level which has only occurred 5 times since GFC. Following each, VIX jumped by over 50% within the few months succeeding.
Election years also tend to top during August, before entering January with a little year-end rally.
$VIX $QQQ $SPY #seasonality
$XYZ, the path of least resistance was laid out and followed.
+24% ✅
MA crossover and consolidation was hinting a rally towards the upper half of the channel. Target was gap at $82, and that’s exactly where it went.