This is why you don't miss #MarketMoves. Today I discussed how the market above 6700 SPX was constructive and a reclaim of 6800 slingshots towards 6900...
Join us Weekly and Daily in the Volland Discord for $ES $SPX plans. Promo code DARKMATTER
https://t.co/LmOWPDj5gI
Another great episode with @WizOfOps where we discussed today's resistance levels of 6440 and 6425 $SPX just before the open in this mornings RTH session...
We do this weekly here on X and Youtube. Join https://t.co/01hy4IQLZt and get 10% off your first month - code DARKMATTER
You can see the aggregate vanna reading live on the Volland Dashboard.
That's your edge — knowing whether dealers are being forced to buy or sell before price confirms anything.
Volland visualizes this data in plain English.
Link in bio for a discount.
Most retail traders have no idea that options dealers move markets.
Not because they're trying to — but because they're forced to.
Here's the Greek that explains how, and why it shows up in price before you ever see it on a chart.
Negative aggregate vanna = the opposite. IV rising forces dealers to SELL.
They're not making a directional bet — they're just managing risk. But the market doesn't care about their intentions.
Negative vanna weeks tend to be choppy, mean-reverting, or outright bearish.
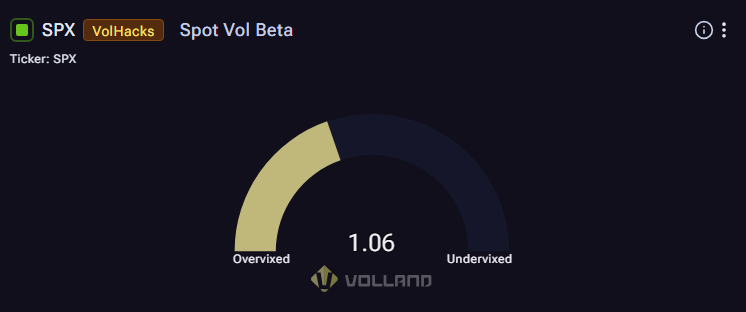
Spot Vol Beta
This gauge shows how sensitive S&P 500 option volatility is to moves in the index itself. A reading of 1.06 suggests volatility is reacting slightly more than normal to price changes, but not at extreme levels. Overall, options pricing appears fairly balanced rather than clearly over- or underpriced.
Vol Event study by @wizofops
Source: https://t.co/wR9hqXIoUG
Charm works with vanna when implied volatility is falling.
It works against vanna when implied volatility is rising.
This explains why some days trend cleanly and others chop violently.