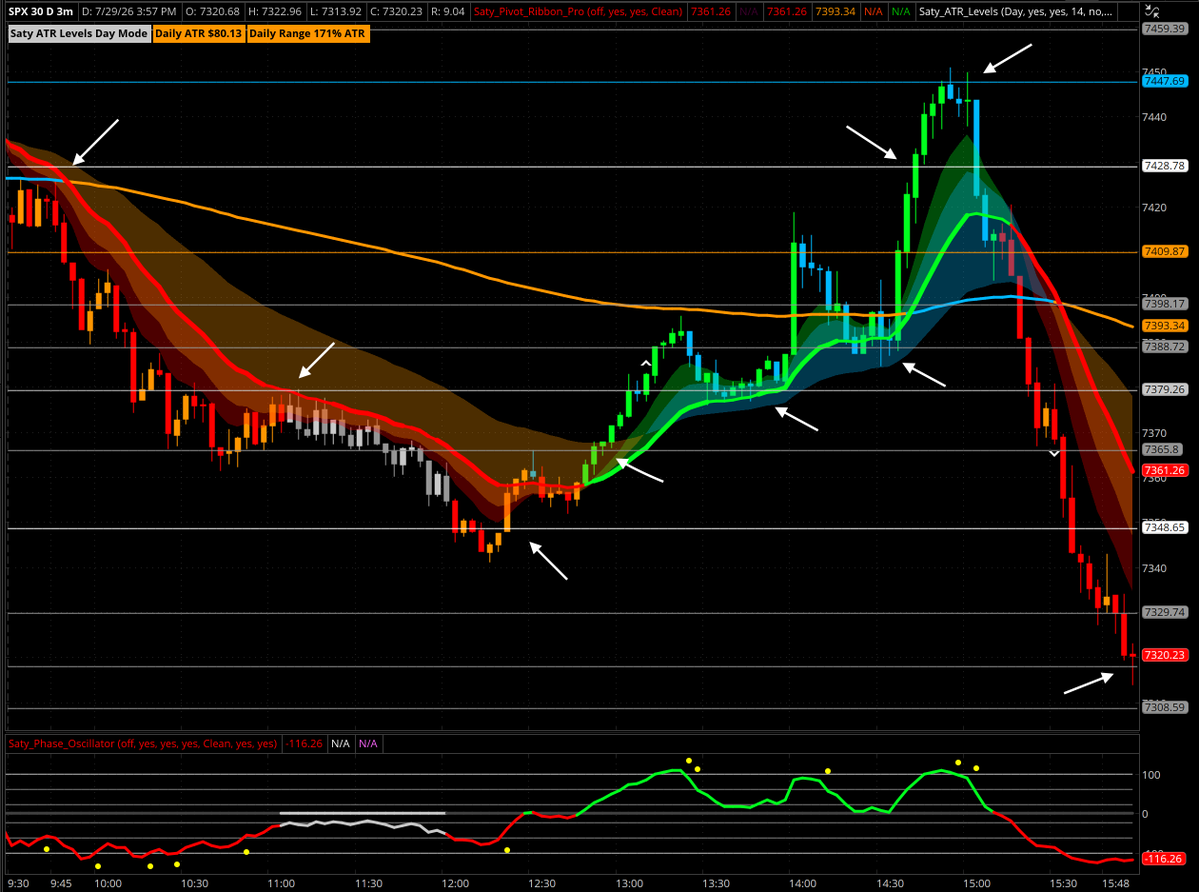
Some random guy on the internet 4.5 years ago made an algorithm that automatically calculates levels. For example yesterday after close, these were today's levels. Worked out well.
He gave this indicator out for free and even teaches you how to use it for free too. Nice guy.
I am not a bull or bear. I am profit-biased.
I am on Team Price, Volume, Levels, and Trend.
I trade the chart not my heart.
Some of you are too emotionally attached to externalities.
Only price pays.
$SPY Quick view of how the gamma looks today ahead of the update.
Easy read. 598 being 🔑
lose it and can chop into 595/594 - further pull into 590 & phantoms below.
Hold it, back into 600/602 - further push back into 605
Monday $SPY Outlook:
Being mindful of possible choppy PA again to start the week. Our chop zone is 598-601 where you want to avoid getting caught. Smaller targets to start the week playing safe.
⚪️Bull: Over 601, >602,>604🎯
🟣Bear: Under 598, >597,>596🎯
$SPY gaps down — call wall at 550–553 just got torched
🕒 $SPY 0DTE Options (Apr 30, 2025 – premarket)
📈 Call Vol: 347.6K
📉 Put Vol: 493.8K
⚖️ ATM Straddle: ±9.08 pts
📊 Skew: 4.3 (📈 bullish)
📊 ITM Ratio: 71.4 (📉 bearish)
📊 Imbalance: –85.8% Put Flow
🔥 Top Call: 76.8K @ 555C
🔥 Top Put: 65.3K @ 550P
➡️ SPY opened below the 550–553 call wall — trapping yesterday’s buyers
➡️ Dealers may be unwinding long hedges, adding to downside
➡️ 555C holds size, but it’s out of reach unless bulls reclaim 550+
Watching for a reclaim of 548–550 early. If not, downside can accelerate.
Give me a ❤️ if you're tracking these flows in real time.
🚨 $SPX mid-day check — 5500 is the battleground for trend reversal
🕒 $SPX 0DTE Options (Apr 24, 2025, Midday Update)
📈 Call Vol: 246.9K
📉 Put Vol: 184.8K
⚖️ ATM Straddle: ±36.5 pts
📊 Skew: 7.59 vs 8.55 (Bearish → trying to flip)
🔥 Top Call: 34.4K @ 5500
🔥 Top Put: 27.4K @ 5400
➡️ Price is pushing into 5450+ with massive call interest stacked up at 5500. If bulls can clear it, this may signal a trend shift from bearish to bullish.
Volume's there. Now it’s all about follow-through. Momentum traders watching this zone closely.
💬 Give me a ❤️ if you want me to keep dropping these intraday breakdowns.
#SPX #0DTE #OptionsFlow #TradingView #OptionsTrading #SmartMoney #FinTwit #Markets #DayTrading
@Pt_Gambler An absolute Options+
must have indicator. Never been easier to see Call and Put volume for strikes without paying big $$ for a data platform. Thank you for this tool.
Getting our $SPY levels out early to everyone.
This shaded area in the background is a VERY large Ghost Zone $525-550.
Remember that price can move more freely throughout GZ's. A very large potential range today. Keep a close eye on NetFlow! 🍿
Monday $SPY Outlook:
Gap up into previous gap over our 537 lvl. Use it as the line in sand today; confluence with 549 lvl & GBands median for up-side. HTF MA supportive at 525 if lose down-side 529 target.
⚪️Bull: Hold 537, up-side 549🎯
🟣Bear: Lose 537, down-side 529🎯
Who wants this beautiful options flow profile right on their chart? 😍📈
This view from my Options Chart+ [Pt] tool shows:
✅ Calls stacked at 550–560
✅ Puts concentrated around 500–510
✅ Volume-weighted DIM: 1.7 (bearish)
✅ Total Implied Move: ±13.86
✅ Full strike-by-strike volume map + sentiment
Works in real-time for $SPY, $QQQ , $AAPL, $TSLA & more.
Want a 2-week free trial? DM me your TradingView ID.
🔗 https://t.co/rX0swa8mCx
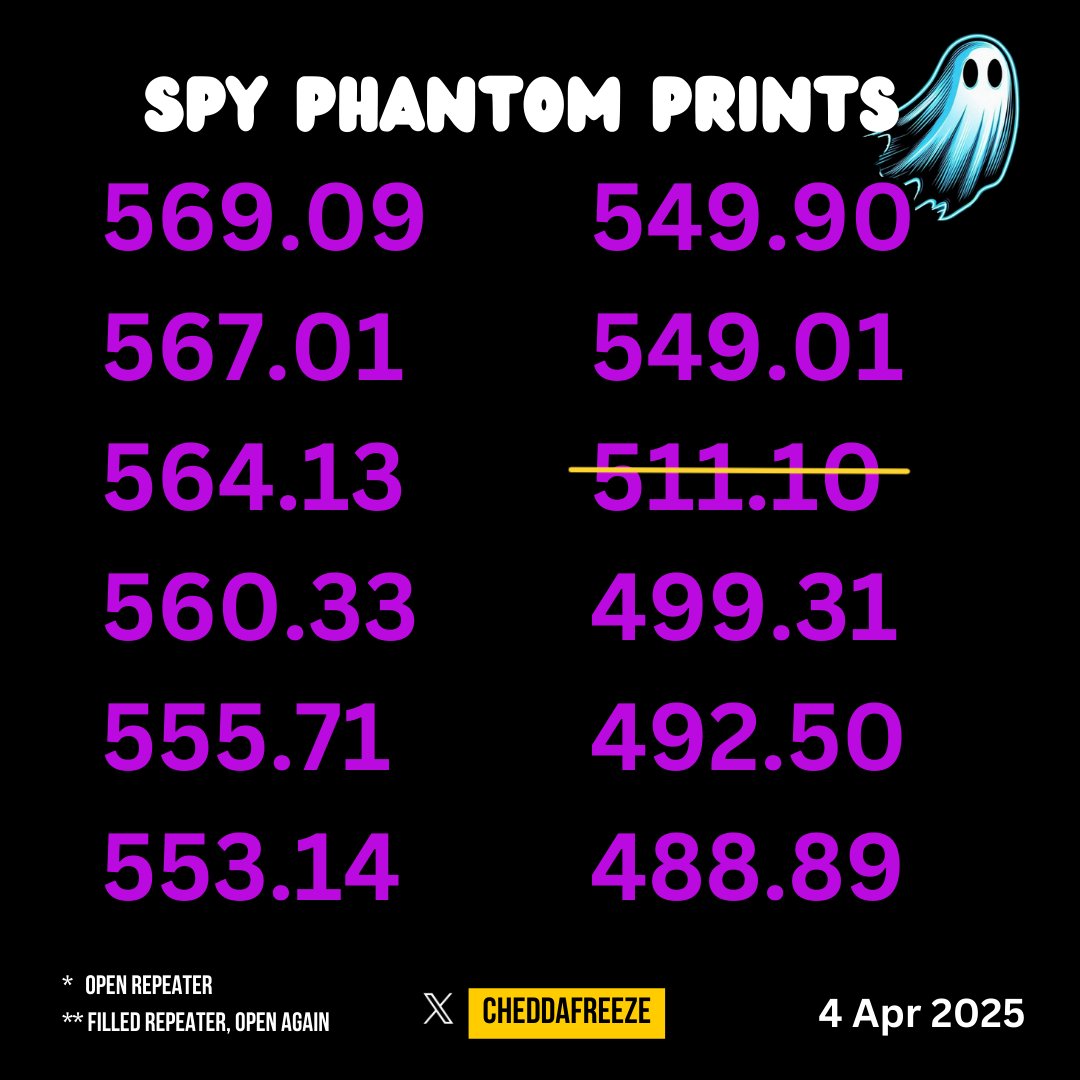
$SPY Phantom Prints from Friday 4/4
One hit immediately as it came in Friday.
All small, under 50 in size.
549.01 is now the closest upside print.
Mark on your own.







![Pt_Gambler's tweet photo. Who wants this beautiful options flow profile right on their chart? 😍📈
This view from my Options Chart+ [Pt] tool shows:
✅ Calls stacked at 550–560
✅ Puts concentrated around 500–510
✅ Volume-weighted DIM: 1.7 (bearish)
✅ Total Implied Move: ±13.86
✅ Full strike-by-strike volume map + sentiment
Works in real-time for $SPY, $QQQ , $AAPL, $TSLA & more.
Want a 2-week free trial? DM me your TradingView ID.
🔗 https://t.co/rX0swa8mCx](https://pbs.twimg.com/media/GoQSwGEWcAAEVF_.jpg)