Just so everyone knows, this has never happened in the oil market.
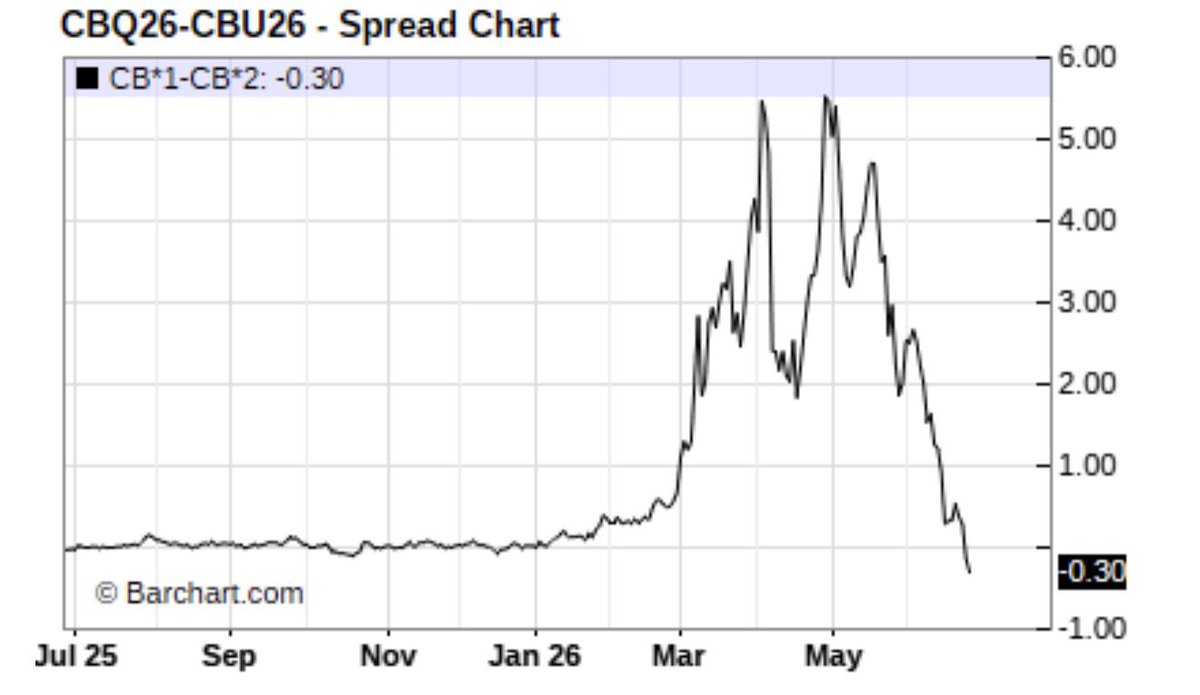
Cracks are back to the highs, and crude timespreads are in contango.
Never happened.
Not in 08, not in 18, 19, 20, 22, never.
Never ever happened.
This chart isn't only about Brent oil futures short positions close to all-time highs when the oil supply shock is about to strike - it also tells you that the run to ~120$ oil price in the first days of March was a short squeeze
⚠️March was a preview of what's going to happen
I continue to be skeptical about this MoU "deal" as I have a hard time to believe that the IRI regime and IRGC intend to play anything else than its own game.
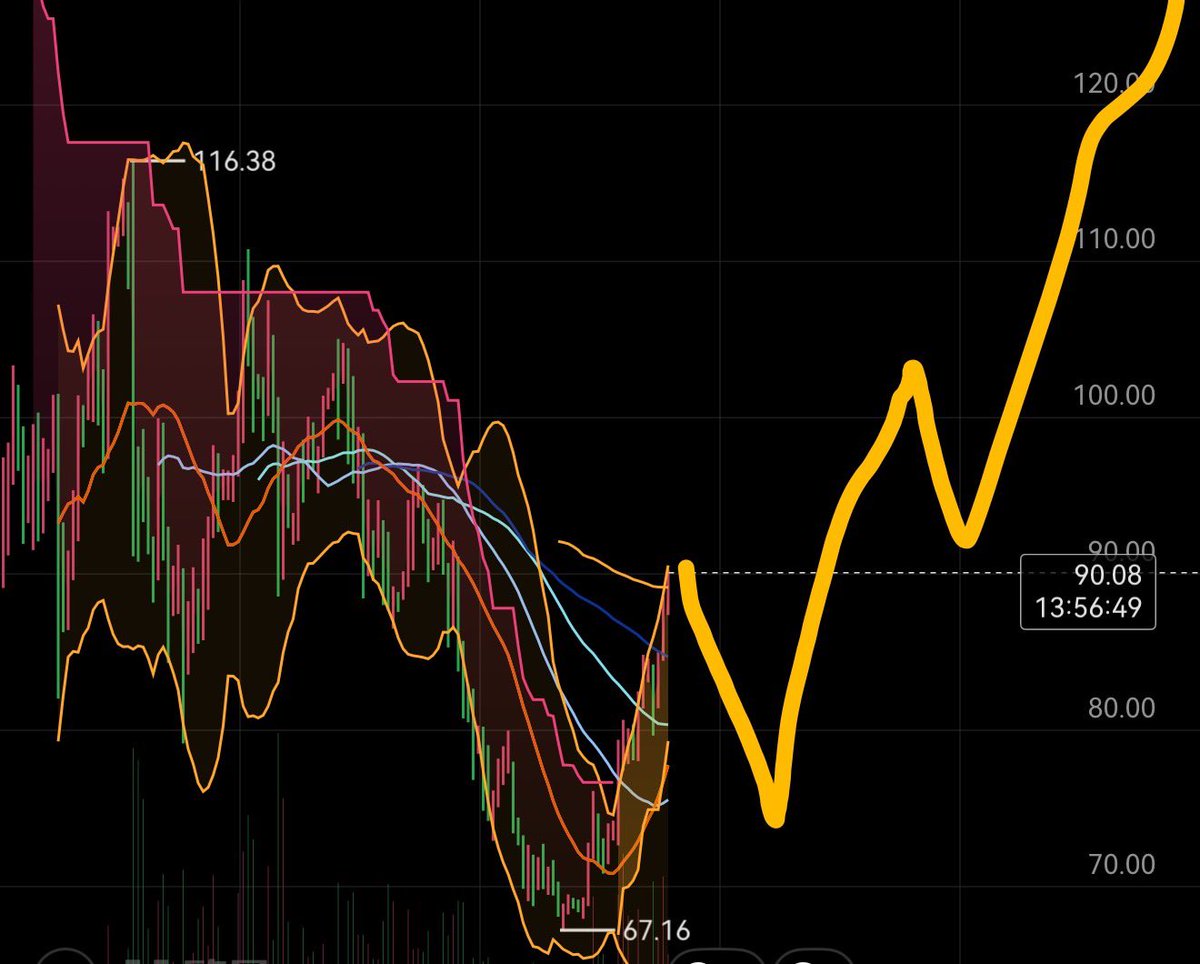
Nevertheless, I think this is the chart to focus on, with a near term bearish count - breaking out of the triangle to the downside.
However, the crucial low of 10 March has to break and that hasn't happened yet but probably will if Friday's signing passes without too much drama.
I changed feed in this chart, to better show the gap between 67.28 and 71.02 (these values may vary in other feeds, where more solid support kicks in.
Both this and the 10 March level also has historical structural support that will make them more of a struggle to pass.
However, note that once the 10 March low is passed, the ABC pattern with the triangle in the middle is technically complete and price can turn at any time on markets direction. I see the main window for this to happen within the next 60 days, but probably sooner rather than later.