20 years in Tech, Stock Trading + Analysis Pro. Learn how to “Know the Move BEFORE the Move”, Algorithmically. Teacher/Student. Knowledge NOT FinancialAdvice
For ppl who don’t know me: I’m a software/technology professional with ~20 years of experience — from semiconductor companies like Broadcom to consumer tech like Apple.
I’ve spent years training and performing stock chart analysis, long term and short term investing, portfolio management, building proprietary systems that find opportunities — alongside developing algorithmic momentum strategies, doing technical & fundamental analysis, backtesting, and automation for myself.
Now my focus is on teaching and learning the art of analyzing stock charts, identifying their potential, and spotting pivotal zones (point of control).
MUST READ DISCLAIMER:
Commentary, posts and the charts on this profile are only for educational purposes, to learn technical analysis. This is in no way or form financial advice or a recommendation to buy anything at any place on the charts posted. The blue vertical range bar on charts is a part of the technical analysis that is showing and teaching the concept of point of control (also known as the area of decision). This zone is also known as a pivotal zone, where the stock can pivot on either side depending on what buyers and sellers do at this price range. The purpose of these posts is to learn where the point of control lies in the technical analysis of a chart using indicators, trend lines, support, resistances, and patterns. Also i have an algorithm that logs the results of the charts i performed the analysis on to constantly learn and improve the technical analysis.
People viewing my posts are strongly discouraged to place trades based on these analysis. Stock Trading can cause huge losses and hence due diligence and consultation with financial advisor should be done.
I wrote a post called Size Matters.
300,000 of you saw the tweet. And I gathered a lot of you clearly weren’t clicking a link with that title.
So here’s the thread version of why size is more important than entry.
1/n
Hes been a good trader nothing close to legends like Jim Simons who was real deal brilliant, theres many more good traders as good as @markminervini (they just dont compete in championships for fame)
Ego is the main problem with him. If he was more humble and tried to give back knowledge instead of purely maaking profit through books, i think he would be respected more. but still lots of Respect for his skills.
Its a transitionary phase, every few months theres a leap, which is made by AI writing and improving itself and performing better than it has before. its thr compiunding effect and above all that is all without much intervention of humans. Now you multiply that rate of change with time and you see am expotential curve, the original article is referring to the exponential curve and the future where the curve has become almost vertical.
@RussLasky@TaraLynnSays@cboyack people are again getting distracted on whose writing. What matters is fact checking, researching for yourslef and having a little farsighted vision to extrapolate the capabilities of the AI using the metrics presetn right now and the rate of change in the direction of the article
wow at this point when such comparisons are made, its very obvious thr audience doesnt understand the tech, what they understand and trying to compare is the past rumors thar didnt carry any logical nor data backed basis. AI right now is improving exponentially every week. Its not rumors, you can use and compare every few weeks, plz try it for yourself.
The point here is not to win a discussion or prove someone wrong for the sake of it. the point is just a heads up and a reality check, after that its your life, you can live believing Sun rises from the west. it wont change the fact.
whaaaaaatt??? this means you are not techincal and dont really understand AI. which is the main problem of most contrarions to the persons article who is worked in tech and understands AI capabilities and growth and so obviously visible increases in flawless capabilities. ive worked in tec for almost 20 years, worked on products that use AI, worked at Apple, Broadcom. I understand inside out of how the tech works and I'm telljnf you its not too extreme what the original article that was shared
@kainatmalik1994 unfortunately i have been a little inactive on X due to focusing on a project around private investors portfolio management.
Yes as far TSLA goes i was expecting a draw down to 420s thats always going to be a good support range. 420 to 430
$TSLA Tesla, Inc.
🚨 UPDATE: +19% 🚨
“Know the Move Before the Move” - Shan
Successful Move Logged (+19%) 🚀🚀
The stock is up +19% since my “StockPick for analysis” post (attached below), now breaking into new all-time highs from the Point of Control (POC).
Price continues to respect the BlueZone and expand higher — the chart structure remains in control of the move as long as this pivotal zone holds.
$SPY $QQQ $VIX $TSLA $NVDA $AAPL $MSFT $GOOGL $META $AMZN $AMD $PANW $CRWD $IBM $BTC
#EV #ElectricVehicles #AI #TechStocks #StockMarket #StocksToWatch #AlwaysWithAStopLoss
Disclaimer:
This commentary and the charts are only for educational purposes to learn technical analysis and how to trade with risk management. This is in no way or form financial advice or a recommendation to buy anything at any place on the chart.
The BlueZone is a part of the technical analysis that is showing and teaching the concept of Point of Control (also known as the Area of Decision).
The purpose of these posts is to learn where the Point of Control lies in the technical analysis of a chart using indicators, trend lines, support, resistances, and patterns.
$TSLA Tesla, Inc.
🚨 UPDATE: +16% 🚨
“Know the Move Before the Move” - Shan
Successful Move Logged (+16%) 🚀🚀🚀
The stock is up +16% since my “StockPick for analysis” post (attached below), making a new all-time high from the Point of Control (POC).
A strong continuation move as price respected the BlueZone and expanded higher — the chart structure continues to define the direction.
$SPY $QQQ $VIX $TSLA $NVDA $AAPL $MSFT $GOOGL $META $AMZN $AMD $PANW $CRWD $IBM $BTC
#EV #ElectricVehicles #AI #TechStocks #StockMarket #StocksToWatch #AlwaysWithAStopLoss
Disclaimer:
This commentary and the charts are only for educational purposes to learn technical analysis and how to trade with risk management. This is in no way or form financial advice or a recommendation to buy anything at any place on the chart.
The BlueZone is a part of the technical analysis that is showing and teaching the concept of Point of Control (also known as the Area of Decision).
The purpose of these posts is to learn where the Point of Control lies in the technical analysis of a chart using indicators, trend lines, support, resistances, and patterns.
@GoshawkTrades@grok simmarize and give me the strategy on what to do based on his lecture. ans also check if this strategy was applied on 2025. would have it been aa profitable
$TSLA Tesla, Inc.
🚨 UPDATE: +16% 🚨
“Know the Move Before the Move” - Shan
Successful Move Logged (+16%) 🚀🚀🚀
The stock is up +16% since my “StockPick for analysis” post (attached below), making a new all-time high from the Point of Control (POC).
A strong continuation move as price respected the BlueZone and expanded higher — the chart structure continues to define the direction.
$SPY $QQQ $VIX $TSLA $NVDA $AAPL $MSFT $GOOGL $META $AMZN $AMD $PANW $CRWD $IBM $BTC
#EV #ElectricVehicles #AI #TechStocks #StockMarket #StocksToWatch #AlwaysWithAStopLoss
Disclaimer:
This commentary and the charts are only for educational purposes to learn technical analysis and how to trade with risk management. This is in no way or form financial advice or a recommendation to buy anything at any place on the chart.
The BlueZone is a part of the technical analysis that is showing and teaching the concept of Point of Control (also known as the Area of Decision).
The purpose of these posts is to learn where the Point of Control lies in the technical analysis of a chart using indicators, trend lines, support, resistances, and patterns.
$TSLA Tesla, Inc.
🚨 MyStockPick for Analysis Today 🚨
“Know the Move Before the Move” - Shan
Looking at the technical analysis displayed on the chart, we can see the Point of Control (POC) forming in the BlueZone, based on the current price action and developing pattern behavior.
This zone is also known as a pivotal zone, where the stock can pivot on either side depending on what buyers and sellers do at this price range.
$SPY $QQQ $VIX $TSLA $NVDA $AAPL $MSFT $GOOGL $META $AMZN $AMD $PANW $CRWD $IBM $BTC
#EV #ElectricVehicles #AI #AutonomousDriving #CleanEnergy #TechStocks #Investing #StockMarket #StocksToWatch #AlwaysWithAStopLoss
Disclaimer:
This commentary and the charts are only for educational purposes to learn technical analysis and how to trade with risk management. This is in no way or form financial advice or a recommendation to buy anything at any place on the chart.
The BlueZone is a part of the technical analysis that is showing and teaching the concept of Point of Control (also known as the Area of Decision).
The purpose of these posts is to learn where the Point of Control lies in the technical analysis of a chart using indicators, trend lines, support, resistances, and patterns.
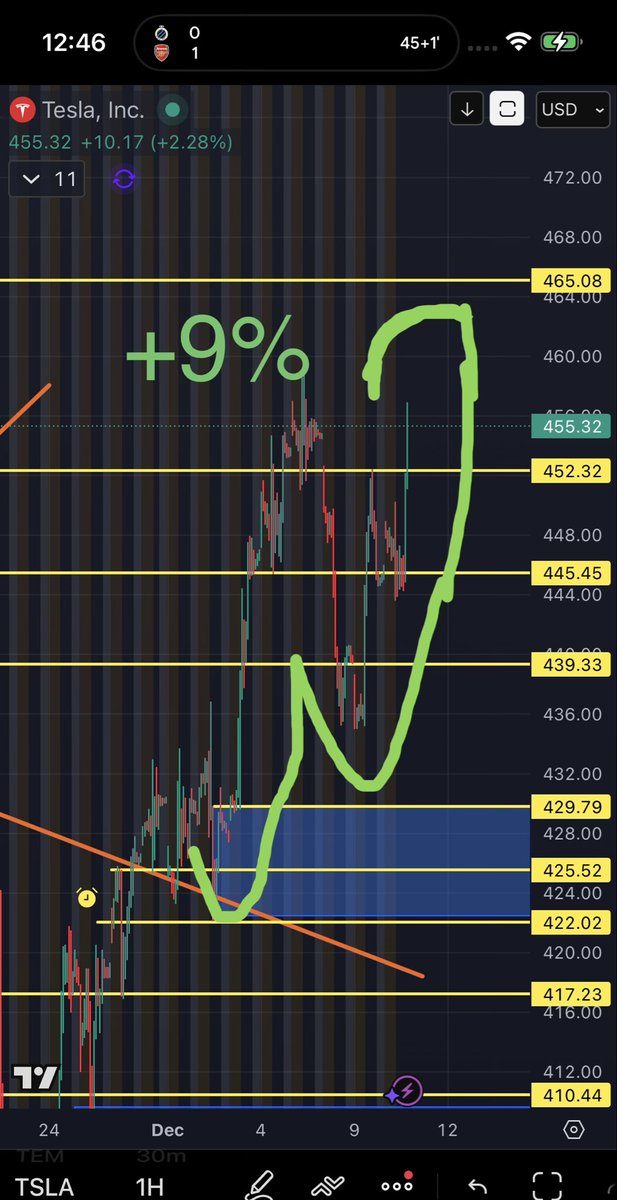
$TSLA Tesla, Inc.
🚨 UPDATE: +9% 🚨
“Know the Move Before the Move” - Shan
Successful Move Logged (+9%) 🚀🚀🚀
The stock is up +9% since the “StockPick for Analysis” post (attached below).
A strong continuation so far, showing how identifying the Pivotal BlueZone early can reveal meaningful directional moves.
Monitoring next key levels to see whether this momentum extends or begins to cool — the chart will guide the next steps.
$SPY $QQQ $VIX $TSLA $BTC
#EV #ElectricVehicles #TechStocks #StocksToWatch #MomentumTrading #AlwaysWithAStopLoss
Disclaimer:
This commentary and the charts are only for educational purposes to learn technical analysis and how to trade with risk management. This is in no way or form financial advice or a recommendation to buy anything at any place on the chart.
The BlueZone is a part of the technical analysis that is showing and teaching the concept of Point of Control (also known as the Area of Decision).
The purpose of these posts is to learn where the Point of Control lies in the technical analysis of a chart using indicators, trend lines, support, resistances, and patterns.
$TSLA Tesla, Inc.
🚨 MyStockPick for Analysis Today 🚨
“Know the Move Before the Move” - Shan
Looking at the technical analysis displayed on the chart, we can see the Point of Control (POC) forming in the BlueZone, based on the current price action and developing pattern behavior.
This zone is also known as a pivotal zone, where the stock can pivot on either side depending on what buyers and sellers do at this price range.
$SPY $QQQ $VIX $TSLA $NVDA $AAPL $MSFT $GOOGL $META $AMZN $AMD $PANW $CRWD $IBM $BTC
#EV #ElectricVehicles #AI #AutonomousDriving #CleanEnergy #TechStocks #Investing #StockMarket #StocksToWatch #AlwaysWithAStopLoss
Disclaimer:
This commentary and the charts are only for educational purposes to learn technical analysis and how to trade with risk management. This is in no way or form financial advice or a recommendation to buy anything at any place on the chart.
The BlueZone is a part of the technical analysis that is showing and teaching the concept of Point of Control (also known as the Area of Decision).
The purpose of these posts is to learn where the Point of Control lies in the technical analysis of a chart using indicators, trend lines, support, resistances, and patterns.
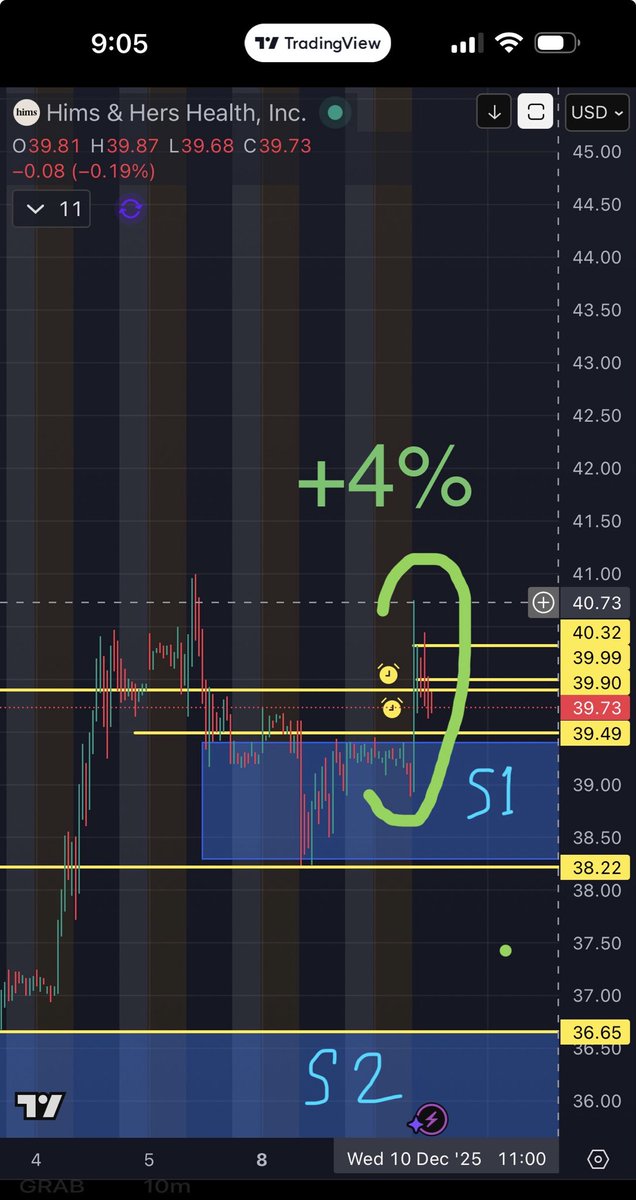
$HIMS Hims & Hers Health, Inc.
🚨 UPDATE: +4% 🚨
“Know the Move Before the Move” - Shan
Successful Move Logged (+4%) 🚀🚀🚀
The stock is up +4% since the “StockPick for Analysis” post (attached below). After hitting +4%, it started moving downward — and this is exactly where risk management becomes essential.
When a positive move begins to fade and your gains shrink by 1–2%, the disciplined approach is to exit the position rather than let a winning trade turn into a loss.
A good reminder that even solid setups require strict downside control.
$SPY $QQQ $VIX $HIMS $BTC
#Telehealth #HealthTech #Investing #StocksToWatch #RiskManagement #AlwaysWithAStopLoss
Disclaimer:
This commentary and the charts are only for educational purposes to learn technical analysis and how to trade with risk management. This is in no way or form financial advice or a recommendation to buy anything at any place on the chart.
The BlueZone is a part of the technical analysis that is showing and teaching the concept of Point of Control (also known as the Area of Decision).
The purpose of these posts is to learn where the Point of Control lies in the technical analysis of a chart using indicators, trend lines, support, resistances, and patterns.
$HIMS Hims & Hers Health, Inc.
🚨 MyStockPick for Analysis Today 🚨
“Know the Move Before the Move” - Shan
Looking at the technical analysis displayed on the chart, we can see the Point of Control (POC) sitting inside the BlueZone, based on the patterns forming on the chart.
This zone is also known as a pivotal zone, where the stock can pivot on either side depending on what buyers and sellers do at this price range.
If the stock respects this BlueZone, it may act as the key decision zone for a potential reversal. Continuation into this zone shows where momentum is building, and a move above the POC could start a stronger upside trend—as long as the market supports it.
$SPY $QQQ $VIX $HIMS $BTC
#Telehealth #HealthTech #DigitalHealth #Investing #StockMarket #StocksToWatch #AlwaysWithAStopLoss
Disclaimer:
This commentary and the charts are only for educational purposes to learn technical analysis and how to trade with risk management. This is in no way or form financial advice or a recommendation to buy anything at any place on the chart.
The BlueZone is a part of the technical analysis that is showing and teaching the concept of Point of Control (also known as the Area of Decision).
The purpose of these posts is to learn where the Point of Control lies in the technical analysis of a chart using indicators, trend lines, support, resistances, and patterns.
$ELF e.l.f. Beauty, Inc.
🚨 UPDATE: +6% 🚨
“Know the Move Before the Move” - Shan
Successful Move Logged (+6%) 🚀🚀🚀
The stock is up +6% since my “StockPick for analysis” post (attached below) and is now sitting at an impressive +25% from the original StockPick tweet.
A clean continuation move as the technical levels and the BlueZone reaction continue to play out beautifully on the chart.
$SPY $QQQ $VIX $ELF $ULTA $TSLA $NVDA $AAPL $MSFT $GOOGL $META $AMZN $AMD $PANW $CRWD $IBM $BTC
#BeautyStocks #ConsumerSector #RetailStocks #MarketAnalysis #Investing #StockMarket #StocksToWatch #AlwaysWithAStopLoss
Disclaimer:
This commentary and the charts are only for educational purposes to learn technical analysis and how to trade with risk management. This is in no way or form financial advice or a recommendation to buy anything at any place on the chart.
The BlueZone is a part of the technical analysis that is showing and teaching the concept of Point of Control (also known as the Area of Decision).
The purpose of these posts is to learn where the Point of Control lies in the technical analysis of a chart using indicators, trend lines, support, resistances, and patterns.
$ELF e.l.f. Beauty, Inc.
🚨 MyStockPick for Analysis Today 🚨
“Know the Move Before the Move” - Shan
From S1, the stock is already up +15%, showing a strong reaction from the first support level.
Looking at the technical analysis displayed on the chart, we can see the Point of Control (POC) forming in the BlueZone, based on the developing price structure and pattern behavior.
This zone is also known as a pivotal zone, where the stock can pivot on either side depending on what buyers and sellers do at this price range.
In this chart, you can also see two key supports — S1 and S2:
•S1: Already triggered earlier and produced a strong +6% upward reaction.
•S2: Now showing a fresh opportunity as the stock begins to take off from this support.
If the market holds, this S2 setup may continue its upward trajectory from the BlueZone.
$SPY $QQQ $VIX $ELF $TSLA $NVDA $AAPL $MSFT $GOOGL $META $AMZN $AMD $PANW $CRWD $IBM $BTC
#Beauty #Cosmetics #Retail #Consumer #MomentumStocks #AI #Investing #StockMarket #StocksToWatch #AlwaysWithAStopLoss
Disclaimer:
This commentary and the charts are only for educational purposes to learn technical analysis and how to trade with risk management. This is in no way or form financial advice or a recommendation to buy anything at any place on the chart.
The BlueZone is a part of the technical analysis that is showing and teaching the concept of Point of Control (also known as the Area of Decision).
The purpose of these posts is to learn where the Point of Control lies in the technical analysis of a chart using indicators, trend lines, support, resistances, and patterns.
$UPS United Parcel Service, Inc.
🚨 UPDATE: +5% 🚨
“Know the Move Before the Move” - Shan
Successful Move Logged (+5%) 🚀🚀🚀
The stock is up +5% since my “StockPick for analysis” post (attached below).
It reached a clean +5% maximum move from the POC before selling off — another successful move logged as the technical analysis played out precisely through the BlueZone reaction.
$SPY $QQQ $VIX $UPS $FDX $TSLA $NVDA $AAPL $MSFT $GOOGL $META $AMZN $AMD $PANW $CRWD $IBM $BTC
#Logistics #Shipping #IndustrialStocks #MarketAnalysis #Investing #StockMarket #StocksToWatch #AlwaysWithAStopLoss
Disclaimer:
This commentary and the charts are only for educational purposes to learn technical analysis and how to trade with risk management. This is in no way or form financial advice or a recommendation to buy anything at any place on the chart.
The BlueZone is a part of the technical analysis that is showing and teaching the concept of Point of Control (also known as the Area of Decision).
The purpose of these posts is to learn where the Point of Control lies in the technical analysis of a chart using indicators, trend lines, support, resistances, and patterns.
$UPS United Parcel Service, Inc.
🚨 MyStockPick for Analysis Today 🚨
“Know the Move Before the Move” - Shan
Looking at the technical analysis displayed on the chart, we can see the Point of Control (POC) forming in the BlueZone, based on the current price structure and pattern development.
This zone is also known as a pivotal zone, where the stock can pivot on either side depending on what buyers and sellers do at this price range.
$SPY $QQQ $VIX $UPS $FDX $TSLA $NVDA $AAPL $MSFT $GOOGL $META $AMZN $AMD $PANW $CRWD $IBM $BTC
#Logistics #Shipping #Delivery #IndustrialStocks #Investing #StockMarket #AI #StocksToWatch #AlwaysWithAStopLoss
Disclaimer:
This commentary and the charts are only for educational purposes to learn technical analysis and how to trade with risk management. This is in no way or form financial advice or a recommendation to buy anything at any place on the chart.
The BlueZone is a part of the technical analysis that is showing and teaching the concept of Point of Control (also known as the Area of Decision).
The purpose of these posts is to learn where the Point of Control lies in the technical analysis of a chart using indicators, trend lines, support, resistances, and patterns.
$ELF e.l.f. Beauty, Inc.
🚨 MyStockPick for Analysis Today 🚨
“Know the Move Before the Move” - Shan
From S1, the stock is already up +15%, showing a strong reaction from the first support level.
Looking at the technical analysis displayed on the chart, we can see the Point of Control (POC) forming in the BlueZone, based on the developing price structure and pattern behavior.
This zone is also known as a pivotal zone, where the stock can pivot on either side depending on what buyers and sellers do at this price range.
In this chart, you can also see two key supports — S1 and S2:
•S1: Already triggered earlier and produced a strong +6% upward reaction.
•S2: Now showing a fresh opportunity as the stock begins to take off from this support.
If the market holds, this S2 setup may continue its upward trajectory from the BlueZone.
$SPY $QQQ $VIX $ELF $TSLA $NVDA $AAPL $MSFT $GOOGL $META $AMZN $AMD $PANW $CRWD $IBM $BTC
#Beauty #Cosmetics #Retail #Consumer #MomentumStocks #AI #Investing #StockMarket #StocksToWatch #AlwaysWithAStopLoss
Disclaimer:
This commentary and the charts are only for educational purposes to learn technical analysis and how to trade with risk management. This is in no way or form financial advice or a recommendation to buy anything at any place on the chart.
The BlueZone is a part of the technical analysis that is showing and teaching the concept of Point of Control (also known as the Area of Decision).
The purpose of these posts is to learn where the Point of Control lies in the technical analysis of a chart using indicators, trend lines, support, resistances, and patterns.